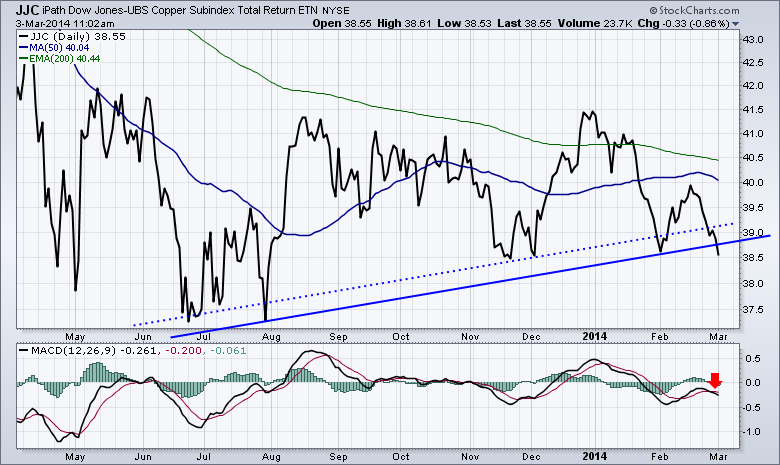
The JJC is a Tracking ETN for Copper. IF (a Big IF there) $COPPER closes below this trend line, this would be significant. We like Dr. $COPPER as an economic indicator.
We have seen the trend weaken recently. The dotted blue line was also a potential support line with two dips through it( late July, Early February). With this third push, it would appear the solid blue line is more meaningful now.
Horizontal Support is at $38.50 on the chart which is where we are trading today. I don't like the negative cross on the MACD below zero.
Good trading,
Greg Schnell, CMT

About the author:
Greg Schnell, CMT, MFTA is Chief Technical Analyst at Osprey Strategic specializing in intermarket and commodities analysis. He is also the co-author of Stock Charts For Dummies (Wiley, 2018). Based in Calgary, Greg is a board member of the Canadian Society of Technical Analysts (CSTA) and the chairman of the CSTA Calgary chapter. He is an active member of both the CMT Association and the International Federation of Technical Analysts (IFTA).
Learn More


