One of the best parts of writing a blog is getting feedback from the readers.
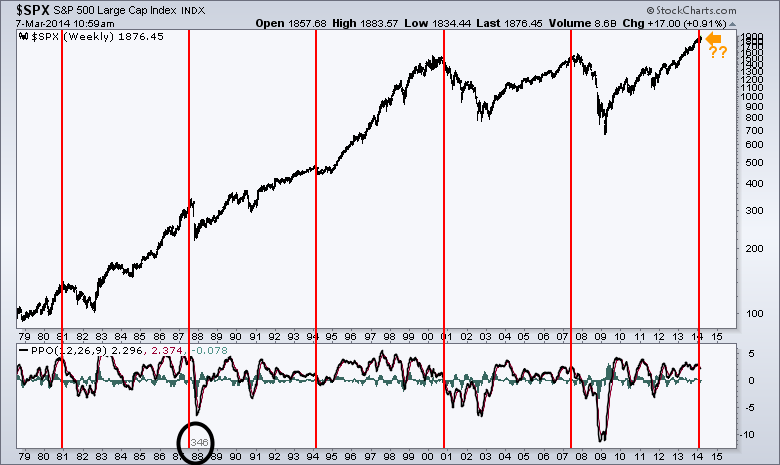
This morning, a friend in Pennsylvania sent in a cycle length I had not looked at. Richard Rhodes of Rhodes Capital Management sent in a cycle length that fits remarkably well marking the major highs in the last 35 years.
What is nice about this approach is the long term view. The surprising thing for me on the PPO (percentage price oscillator) is from very high readings, the market unwound quickly. In 1994 it was just a 1 year pause, but there is no safety in expecting the momentum to wane at market tops. 1981, 1987,2007 all had PPO reading near or above the previous years readings when everything fell apart.
I also notice a camel hump syndrome on the PPO. 2010,2007,2004,1999,1998, 1987 all have two bumps on the top.
Good trading,
Greg Schnell, CMT


