Canada has a few uranium players.Cameco, Fission and Denison are good representatives of the industry. The nuclear industry always portrays a blue sky friendly industry. When it goes wrong, it seems to go real wrong. That would certainly be true for our Canadian Uranium stocks. The 800 pound gorilla Cameco reported earnings today. They were able to make rain on a sunny day. Investors keep looking for bottoms and the charts keep creating tops. A bit like a lake being a mirror.
While the future looks bright for the industry long term, the uranium miners StockCharts are falling rapidly today. Below is Cameco or CCO.TO. The RSI made its first trip into overbought in February so that is a good sign that the stock is changing behaviour. The SCTR was unable to stay above 70 on this rollover. We would like to see it find support here around 50. Looking to price, a nice 2 year base after Fukushima makes the stock interesting. We have clearly broken out above black line resistance. The black line seems to be similar to the lake level. A perfect reflection above and below. We would expect this area to become support on the test it is currently undergoing. If we don't have a support level here, the 40 WMA is just below. These should provide good support. Should they fail to, a move to the centre of the base around $20 would be the next support. Finally, we would like to see it hold the bottom of the base. So that would be my method for thinking about 4 layers of support. The reason I am outlining this is the huge number of nuclear plants coming on stream that should finally create some demand and Cameco has the supply with the big and long Cigar Lake asset. This industry may be out of favor now, but it is worth keeping an eye on for a base to build. Once this finally gets some positive mojo, it should easily make a higher mountain.
As an example, NFLX did the same thing in 2008. After building a strong resistance at $30, the stock broke out and soared up to $40. Then it pulled back, almost to the bottom of the base. When it finally turned around, it was a run for the roses. Perhaps we'll see Cameco finally get a long run up after this next base is built.
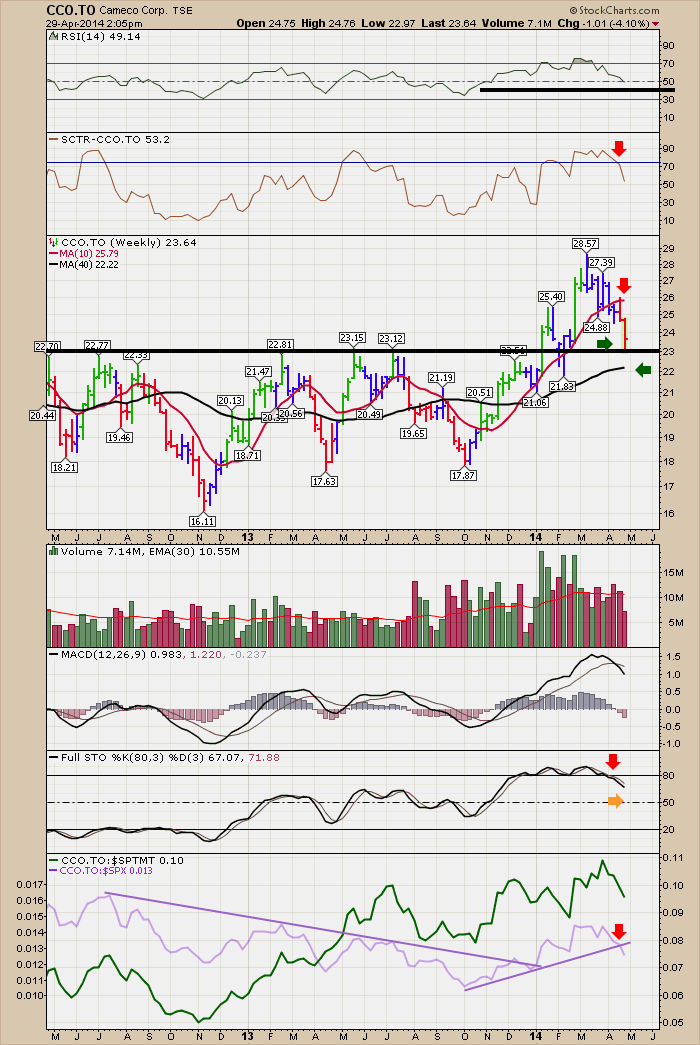
Just a few more things to look at on Cameco. The MACD is pulling back now. We'll have to watch over the next few months to see where it can get some traction. The Full Sto's should find support around 50. The Relative strength line in green against the sector is still sloping up, but looks as though it may start breaking the up slope. The SPURS have broken down now and we will watch for that to base as well.
Here is FCU.V, Fission Uranium.
Fission is a much stronger stock. It trades on the Venture exchange so it is not every investors stock and stocks on the Venture exchange don't have an SCTR ranking. Looking at the chart, the RSI has held up well for 16 months and is testing support at the 50. There is some divergence on the MACD so maybe these stocks have some more room to go down.
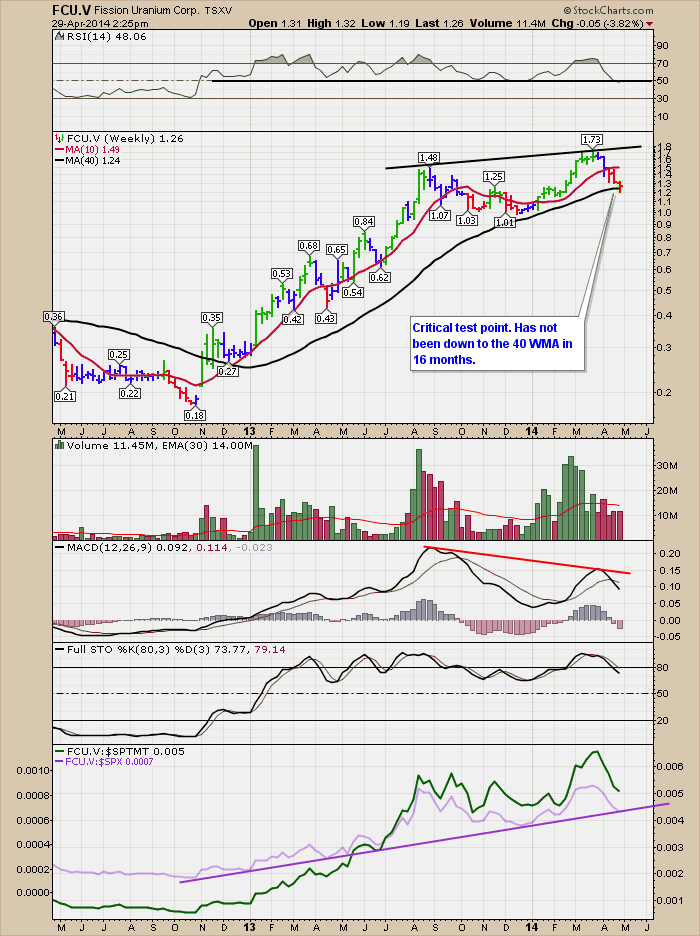
The full sto's have been able to oscillate around the 80 level. So far the trend on the SPURS is still higher.
Here is DML.TO Denison Mines. The RSI made a trip to overbought after being stuck in a bear market pattern below 65. We can see the SCTR finally got some mojo above 70, but now it is pulling back. The significant down trend was finally broken in early January. After the stock almost doubled off the October lows, it has now pulled back 60% of the move up. This will be an interesting stock to watch as it changes direction.
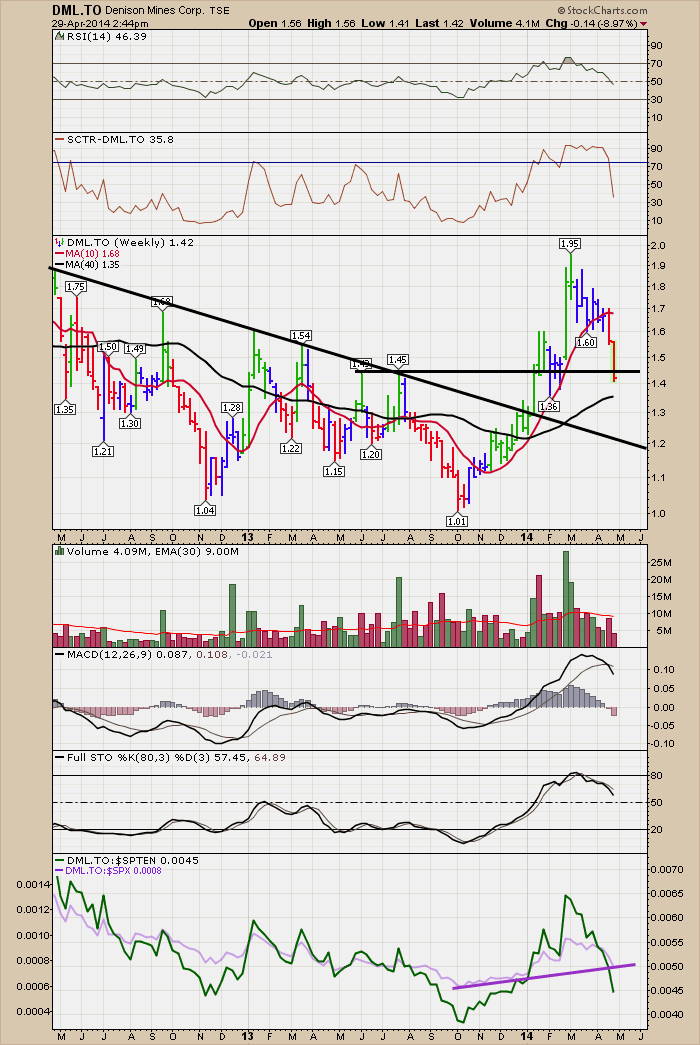
The MACD and the Full Sto's have rolled over and the SCTR is starting to break down. This stock is clearly under performing the materials sector shown in green.
So the surge in uranium stocks seems to be a bit like the fuel itself. Powerful, short bursts of energy. Now the stocks have rolled back down the power curve to find some support. I am looking forward to the next base with more optimism. Will they stop at support or end up falling well below? We are about to find out over the next few months.
Good trading,
Greg Schnell, CMT


