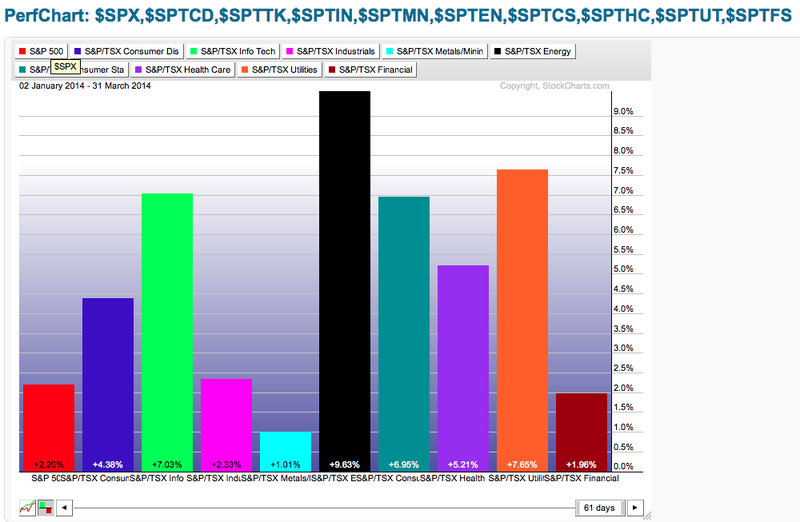
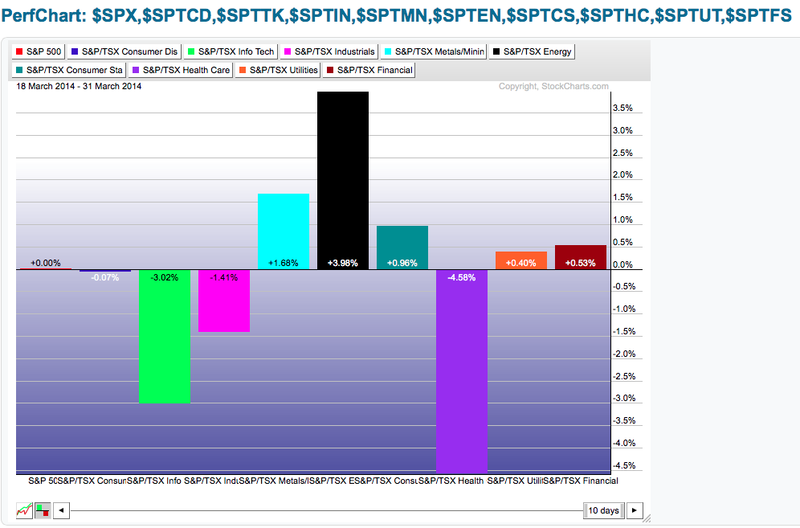
The sectors have rotated rapidly in March. This is the current view of a one month performance chart.
Here was the scene just 2 weeks ago (notice the date in the top left) on a one month chart. Cyclicals shown in dark blue have dropped a couple of percent (compare the lower to the upper chart). Information Tech has fallen hard. The metals have dramatically improved, even though they are still negative. Energy has rocketed higher. Utilities continue to climb.
Look now in the last 10 days. The Cyclicals have done nothing, the Info tech and industrials have pulled back, the metals and energy groups are shooting higher.
Trading the one month time frame can be hard. You may find the 3 month a little more stable. The other way you can do it is to look at the 1 month and 3 month to help you find the major trend.
The bottom line is things are moving quickly. Below is a three month chart and you can see everything has been going higher but being in the right sectors would be the most important.
Good trading,
Greg Schnell, CMT


