The Bullish Percent Index is a great way to see extremes in the market. However, the concern with looking at this indicator now is where we closed last Friday at an extreme level.
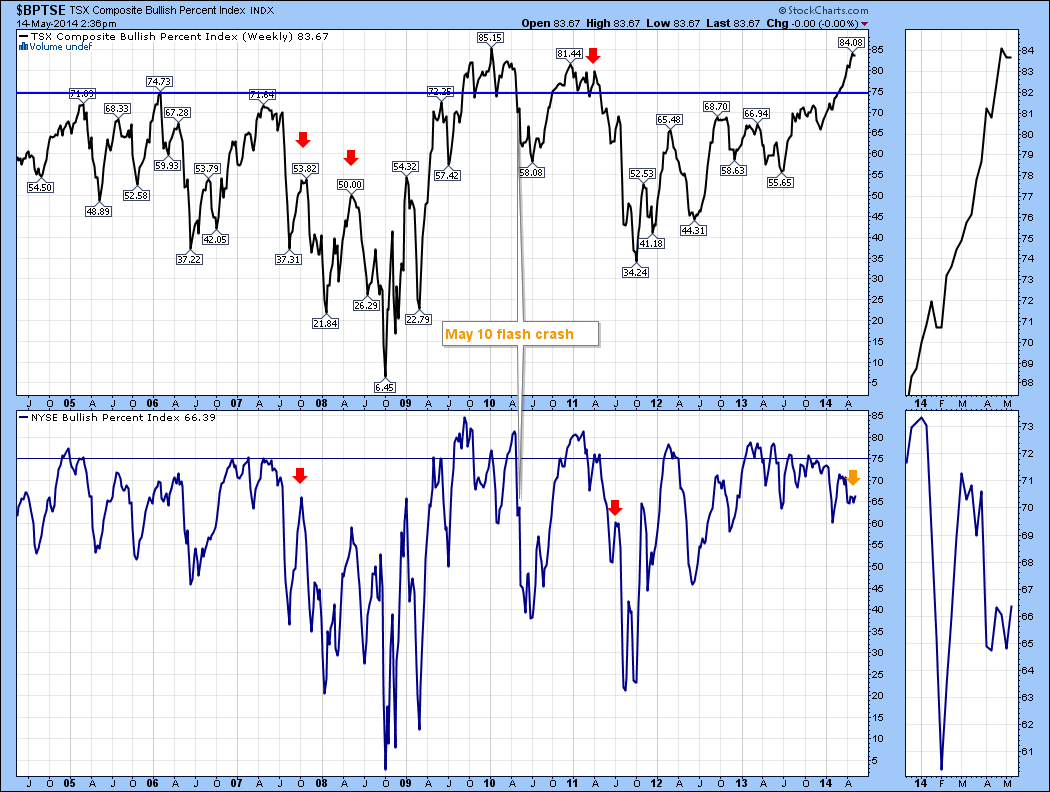
When I study the chart, the market does not seem to top out near these extremes. Would it take time for the market to weaken? The red arrows mark significant market tops. The US 2007 top, the Canadian top in 2008, the 2011 Commodities top.
In 2008, the energy sector continued to surge on the back of crude oil. The rest of the Canadian market was already falling and it peaked at a much lower level. It would appear to me that the most important component is understanding where the strongest sectors are as the market rolls over. Broad diversification would suffer.
Regarding seasonality, the huge bull market of 2013 only had one major pullback. It started mid May. In fact every year saw some weakeness in the May/June timeframe. The Bullish percent readings were already rolling over. One concern I do have is the US market has bullish percent levels that are a lot lower. So they could easily pullback more meaningfully. The divergence in Bullish extremes is a bit puzzling.
The bottom line is that we are near extremes in bullishness. The odds of going higher are severely limited. Some sectors would start to weaken from here so allocating money into strong sectors will be more important.
Good trading,
Greg Schnell,CMT


