The Currency markets are the early movers. The Japanese Yen ($XJY) is a very important global currency. I like to stay aware of major changes in the currencies to help me in the equities market. Lets roll through the 7 major currencies over the next few blogs. These are the crosses that make up the Dollar index.
I'll go through the weekly first on each currency, then roll into the daily. Stage is set, now into the charts.
Let's start in Japan with the Yen. The Yen is used for carry trades.
Here is an example of a Yen carry trade from Investopedia:
"A trader borrows 1,000 Japanese yen from a Japanese bank, converts the funds into U.S. dollars and buys a bond for the equivalent amount. Let's assume that the bond pays 4.5% and the Japanese interest rate is set at 0%. The trader stands to make a profit of 4.5% as long as the exchange rate between the countries does not change. Many professional traders use this trade because the gains can become very large when leverage is taken into consideration. If the trader in our example uses a common leverage factor of 10:1, then she can stand to make a profit of 45%.
The big risk in a carry trade is the uncertainty of exchange rates. Using the example above, if the U.S. dollar were to fall in value relative to the Japanese yen, then the trader would run the risk of losing money. Also, these transactions are generally done with a lot of leverage, so a small movement in exchange rates can result in huge losses unless the position is hedged appropriately."
The Yen is a huge indicator towards equity markets. Here Is the weekly chart of the Japanese Yen ($XJY). If the Yen rises, then the dollar is falling to the Yen, so this negatively affects the carry trade. They can use the trade for equities for large high yield dividends or corporate bonds as well. Looking at Chart 1, just a quick start at the RSI. We can see in the uptrend, the RSI stayed above 40. Immediately after the early 2012 test of the high, we had divergence (lower RSI highs while price was flat) on the RSI from the 3rd Q 2011, 4th Q 2011, then Early Q1 2012. The break of RSI support on a weekly chart is a slow moving train. The right shoulder bounce stalled below 60 on the RSI as the long term trend line broke on the price. One more thing on the RSI currently. The RSI has moved above 50 for the first time since the major slide, however it remains below the 60 level. It is a critical time on the RSI.
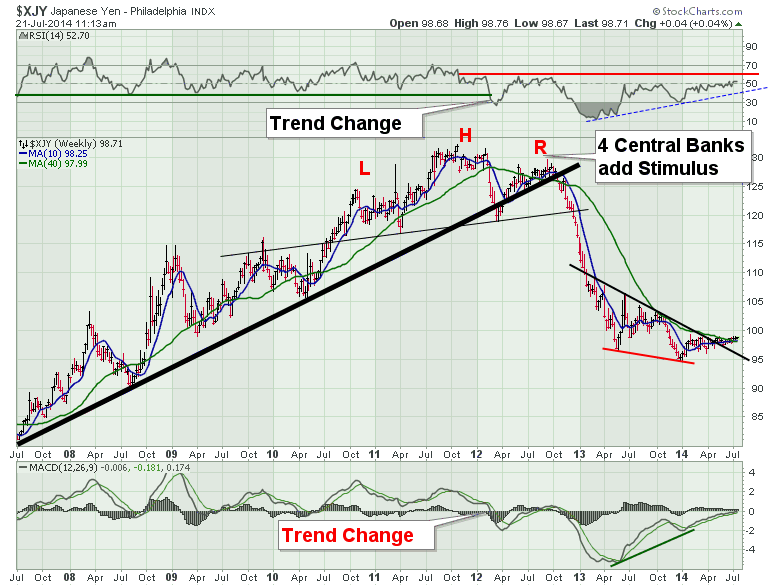
Moving to price, the major up trend broke on the right shoulder of the H/S top. You will also notice that the price never really paused at the final h/s support line shown in thin black at 120 in the Q4 2012. Look what central banks did in Q3 2012. They all added stimulus. The rush into the carry trade was on. Now, the thin black resistance line has been broken to the upside, and the price has moved into a narrower range continuously throughout 2014. This is a significant coiling and would usually lead to a major breakout one way or another. Lastly, note the positive divergence - lower price but higher MACD - at the December 2013 low. The MACD is at a critical point, which also marked a trend change back in 2012 long before the central banks added stimulus. Once the stimulus was added, the carry trade was accelerated and the yen plummeted. Now it becomes critical for the yen. What is not shown on this chart is that the 95-100 level on the Yen is meaningful all the way back to the 1993 - 1995 time frame. It was meaningful resistance back throughout the 2000 top, 2005 and then broke out in 2007. If the Yen found support and started to accelerate meaningfully above that level, would it mark a long term top like 2007? Look at the weekly below.There is a ton of compelling data here that the Yen is at a meaningful turning point.
Starting at the RSI, You can see the up trend marked in blue. Well now the down trend in red has been broken so that suggests further upside. The price action is right in the zone of support. Look how important the 65 week moving average has been. Why 65 week MA? Martin Pring likes 65 WMA. In case you have not heard, Martin will be speaking at the Chartcon 2014. Click here to sign up. From the legend below, the 65 WMA is at 99.19 and over a 30 year chart looks pretty timely. On the chart above I used the 40 WMA which I usually use. Price is now above the 40 WMA and below the 65 WMA. Take your pick, both are important! A slower MA will always have less whipsaws.
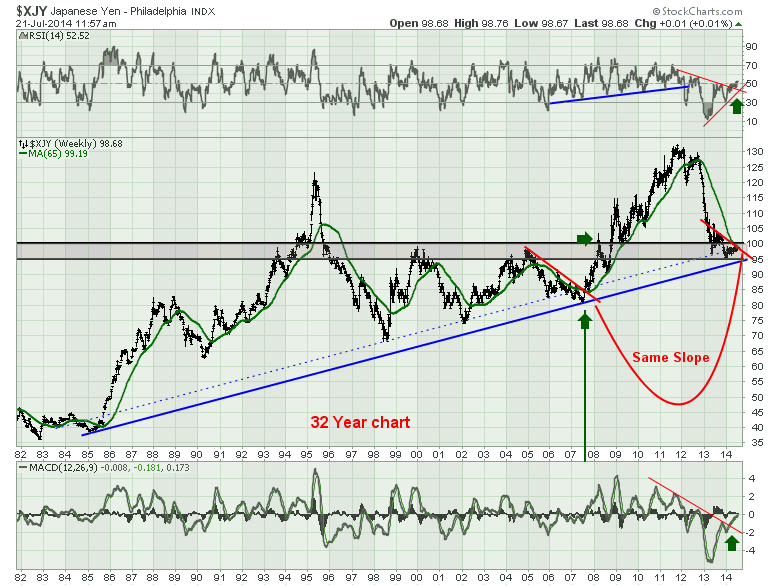
The focus point for me is created by the up sloping trend in blue, the horizontal trend in black and grey, the 40 WMA and the 65 WMA meeting right here. We also have the red downward sloping trend line at the same slope as 2007 and we are just breaking through the topside as sown in Chart 1. You will notice the vertical green line marks the 2007 low for the Yen but also coincides with the top for the US market. It doesn't have to hit on the same quarter, but it is a critical time to watch the Yen for big time frame moves.
Now let's zoom in on the daily below. The RSI is still stuck below the 65 level so no change in trend yet. Rarely does the 'daily' RSI behave this clearly. We can see an RSI uptrend in blue on the daily version of the Japanese Yen. You will notice on the price chart the moving averages are all converging. The Price is also converging. I have put Martin's 65 WMA equivalent (300 DMA) on the charts. This comes in at 99.22 and on the weekly chart it was 99.19 so close enough. You can also see the horizontal support and resistance level in black at the centre of this convergence of MA's. This screams how important this chart is. Should it fail to break out and roll over, I would follow that trend. The market has spent 6 months thinking about it and a final break would be very decisive in my opinion.
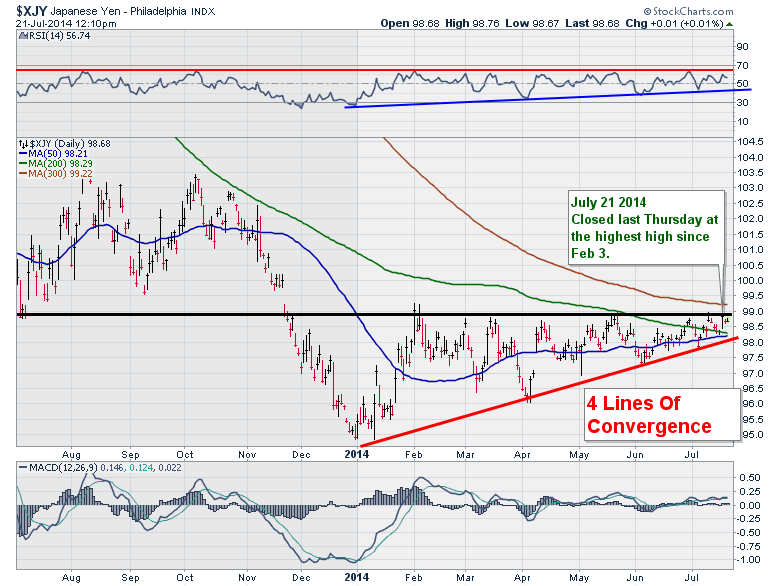
Lastly, the MACD has gone to sleep. To reference the volatility, the calm before the storm. Should it successfully break higher here, I would expect a rapid closing of the carry trade and a sudden move higher. Should it break lower, I would expect a surge in the NIKKEI equity market ($NIKK) for Japan and erase the large head shoulders top currently building. Here is a link to the monthly Nikkei for why a cancellation of that top and a resumed uptrend would be important.
Next we will cover the Aussie and Canadian Dollars. This will give us an important barometer for commodity demand. They are also at critical points on the chart. Feel free to send some comments. I like to hear back!
Good trading,
Greg Schnell, CMT


