Crude is a remarkable fluid which dominates world politics. We have recently seen Russia pushing into the neighbouring markets with Oil and Natural Gas and the rest of the world watches every deal. I want to spend some time reviewing West Texas Intermediate Crude ($WTIC) today and study the chart from a more broad based perspective. Trading in crude oil has been an active traders game.
Normally, we talk about the RSI staying above 40 or below 65. Here we have the RSI shooting from one extreme to the other. We can see the price relative (SPURS) of $WTIC is keeping pace with the $SPX for the last 9 months.
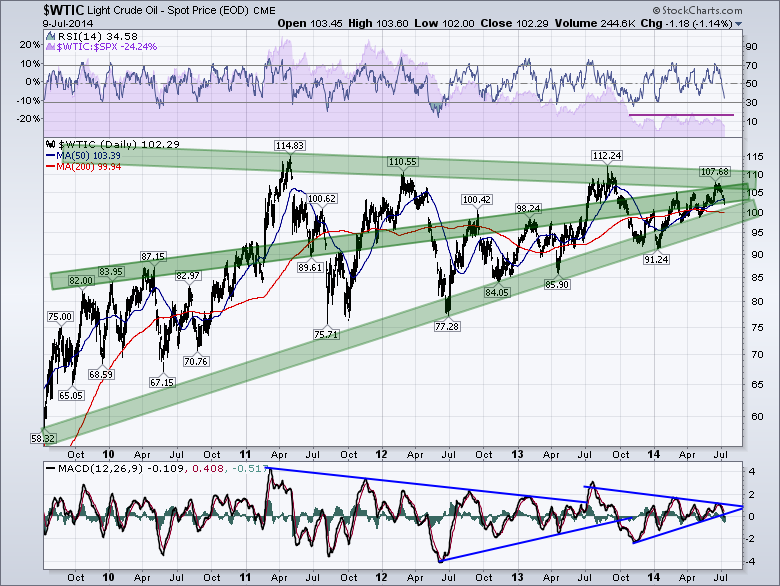
Analyzing the price plot, we can see three distinct green zones on the chart.
All of these bands are about $5 wide. Starting at the support zone at the bottom, there is a clear uptrend from back in 2009. However, we can see the bottom of each price move since the 2012 low has found support on either the top to bottom line of this band. Normally, we would just move up and check resistance levels, but we can see a defined trend through the middle that needs some discussion. Here the zone is more arbitrary, but we see a continuous repression of up moves at either side of the band. All three moves through the zone were accomplished with massive surges and almost no retracement. This would indicate to me that we will need a serious disruption of the energy markets to get crude to blow through this intermediate zone.
Now onto the top trend line, the highest high was at the top of the commodity run into Winter 2011. Each successive peak saw crude oil stay up there for a longer period of time, before ultimately rolling over. In all three cases, the price moved down to the lowest support level.
So this creates an interesting situation. We just bounced off the top zone. We are now testing the bottom of the central zone and would expect price to move to the lowest zone. But we are already there! So now our three trend zones converge and we are left to figure out where crude oil goes from here.
Notice the 200 DMA is horizontal and is in a struggle to get much above $100. While we have lost support of the 50 day now we see the 200 DMA just below at the $100 level. Lastly, on the MACD, you can see where the pennant was forming on the crude oil chart till 2013 and the price broke to the upside. On the most recent MACD pennant, we broke below the lower pennant line today.
Zooming in on the 1 year below , things look a little cleaner. It looks like crude will test the 200 DMA and the RSI should touch 30. The bounce from there should be informative. Summer is very bullish for energy stocks, so I would watch that bounce to see if it should spark some buying. If the 200 DMA doesn't support crude here, there is some horizontal support at $98. That $97-$98 level is also where the green support is on the five year chart above.
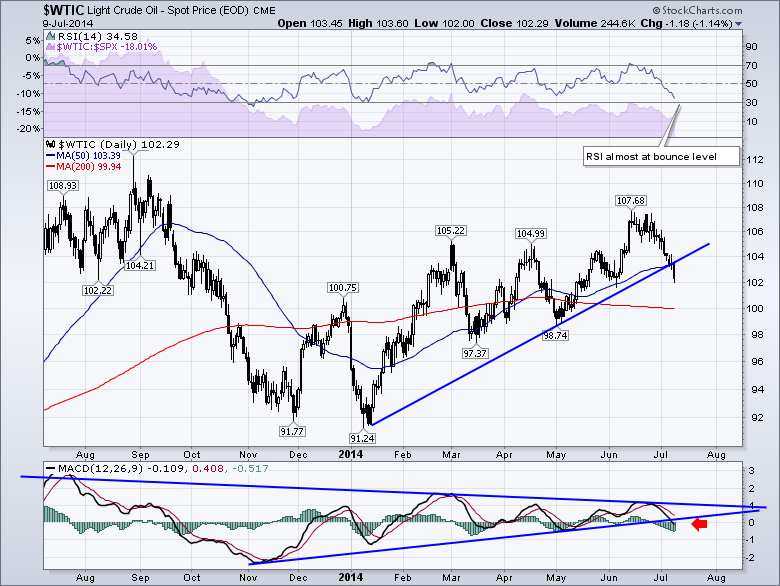
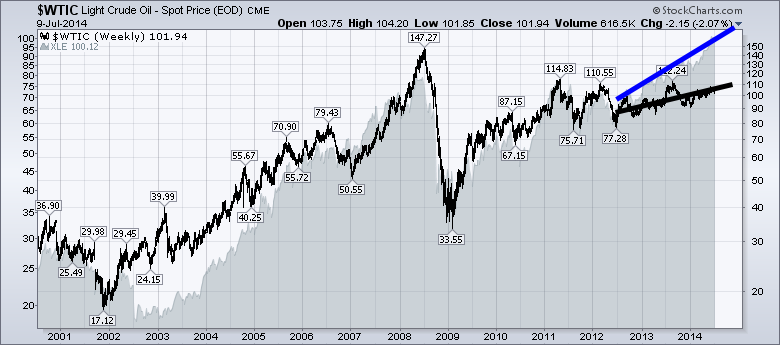
Crude is at a very important area as it reaches down to $97-$100 range. It is not much to work with, but it needs to be a zone of support. Should that fail, a horizontal test of $91 is in order. On the big picture, this 5 year convergence points to the $105 level as the new centre of equilibrium. Be flexible, as breaking into a lower range or higher range will dramatically affect your energy stocks. My optimism says the general trend is higher. My pessimism suggests that everything will pause as the Fed Spend winds down. Those three lines converging probably mark those extreme views converging on the date as we approach the end of QE. While XLE is hovering near all time highs, both Crude Oil and Natural Gas are well below that extreme. This divergence of the stocks from the commodity for 2 years suggests a force stronger than the price of crude as shown in Chart 3. Increased US oil production is sighted by economists. How crude responds to the end of Fed stimulus will tell us if that is it.
Lastly, this is our final push for Chartcon 2014 to fill the venue. We want to see you there. Click here to register!
Good trading,
Greg Schnell, CMT


