Now for the largest European currency and it makes up over 1/2 of the US Dollar Index. The Euro ($XEU). This is arguably the most important chart in the group for the direction of the $USD. However, I think it is very important that we worked through all the other charts to see where they are because they are all at important support or resistance lines.
Starting with the long term Euro Chart, one thing stands out to me. There is a massive 6 year descending triangle forming. That is very important. The other way to think about it is the recent series of lower highs and lower lows. With the exception of the Draghi speech, a channel line suggests this could continue oscillate lower down to 105. The bottom of that channel line would actually be lower than 105 as the months go by and the trend line extends down. The light grey dotted line is a parallel channel of the red line marking the tops. So the declining top trend line and the horizontal support around 122 are currently the zones. While the 135 was meaningful resistance in the 1990's and the first 1/2 of the 1st decade, you'll notice the Euro broke above 135 as the US markets topped out in 2007. With the subprime situation in the fall of 2007 starting to show, everyone moved to the Euro and other world currencies. When the subprime and the debt markets started to quickly unwind in July 2008, investors moved to the safety of the $USD and this shows as a plummeting Euro. One thing that is very interesting is that the 134 level has not provided any support when the Euro rolls over. This would suggest that the 122 level is probably the next level of long term importance. Just doing some quick math, between 80 and 160, the centre of the Euro is 120 as well so even a reversion to the middle of the range is a reasonable expectation.
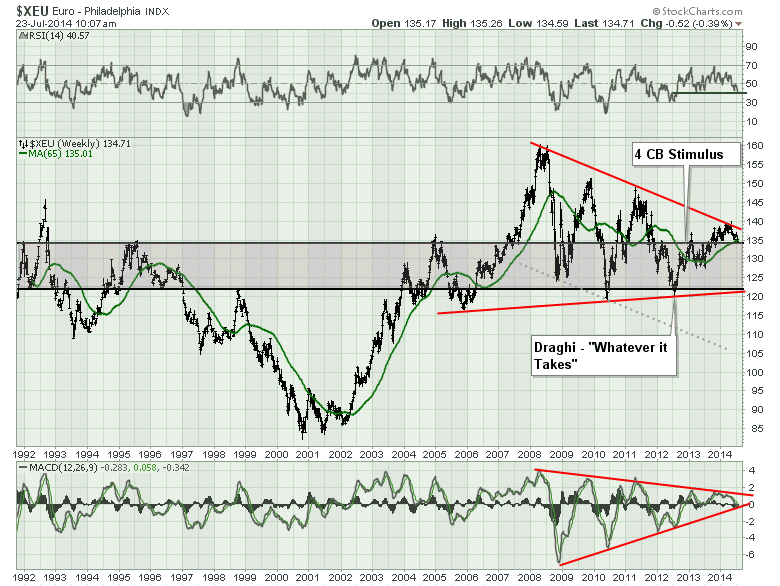
I have one other important thing to consider. Notice the slope of the rallies since 2007. All of them were very vertical impulsive moves except the last one. It was a series of overlapping, grinding moves higher. The break above the Spring 2013 move at 137 never saw a pop or breakout higher. This would suggest the last move with the lower slope and the grinding price action is a corrective wave, not an impulsive wave.
The RSI is currently at 40 which is the bottom end of the bull market range. We can look at it on the zoomed in view of the weekly.
The MACD has an important coiling pattern. It would suggest that a breakout either way will be substantial. By looking at the legend we can see the MACD has a negative in front of it. We can also see the third number has a negative which means the MACD is below the signal line. The second number is the level of the signal line. Time to zoom in on the last few years on a weekly in chart 2.
We can see how strong the RSI was since the Draghi speech in July 2012. We also had the support of the ECB, the Fed, Japan Central Bank and the Chinese Central Bank from October 2012. Onto the price action. The top red line is located at the level with the most touches rather the the two extremes. We can see the two blue trend lines. This would imply the support has failed on both, now that the price has moved below. Looking at the legend, we can confirm that the price has closed below the 65 WMA. The 40 WMA is even higher, so we are now below all the major support levels with the exception of the 134 level. Based on our view from the broader picture, it does not appear that this support level is meaningful. We can see the 127.5 is important.
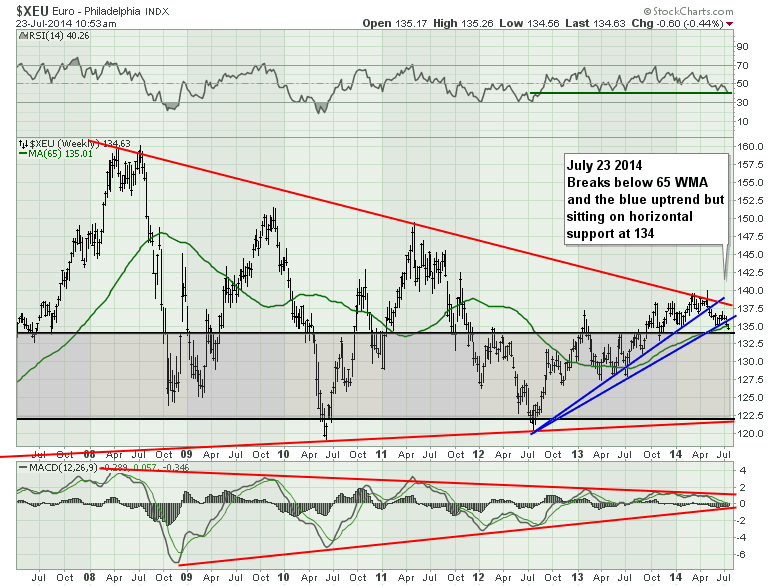
This MACD coil is important. It is below zero but the lines are not accelerating down so that would add a little caution.
Here is the daily. I noticed the RSI is in a bear market. The price has clearly marked out a rolling top or a head/shoulders pattern. Even on this daily chart, this is an important zone that the currency would have a reason to rebound after breaking the neckline. The MACD tested but failed at zero which would confirm the weakness on this right shoulder of the topping pattern.
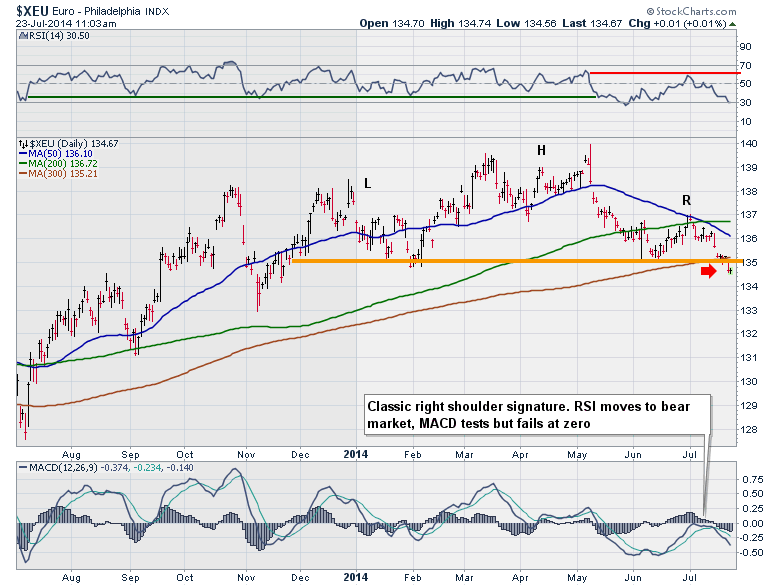
The Euro looks set up to fall here. My expectation is the 134 level does not provide any support and the next level of support is 127.5. This should be very bullish for large multinational European companies that get a lot of their revenues outside of Europe. Companies like Total and Unilever may be the types of companies that get a real bounce on a falling Euro.
I will write a separate blog to summarize all of the currencies, but first we should look at the resulting pressure on the $USD.
Good trading,
Greg Schnell, CMT


