Yesterday I reviewed the 10 largest components of the XEG.TO energy ETF. Today, I'll cover the next 10. These ones are interesting because some of them have been high growth stocks and at some point, worth having on your radar. Let's jump right in with almost all the same chart settings. I took out the always valuable SPURS in purple that were on the top ten. All oil stocks were underperforming so it doesn't help us a lot right now.
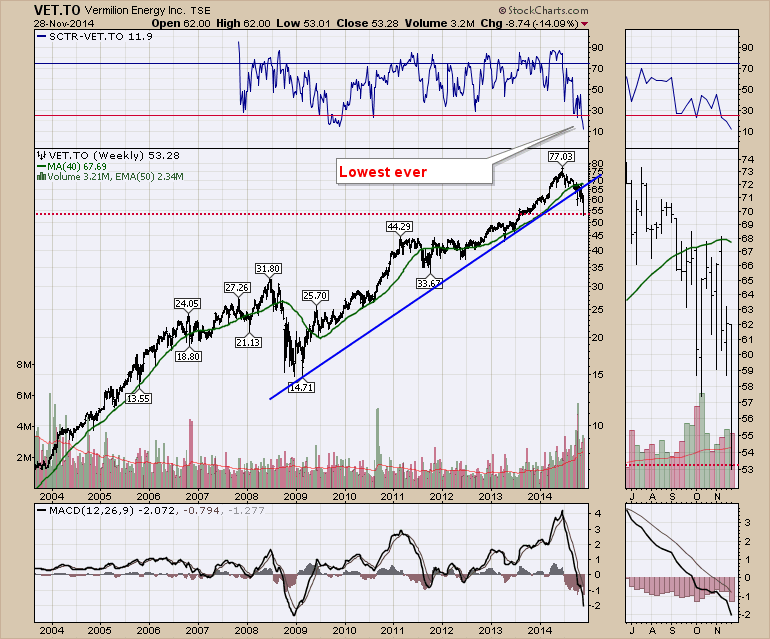
Here is Vermilion Energy. That is a chart to love. Big beautiful run up. Well, it's 31% off the highs. The SPURS ranking has never been this low including when oil was $32. On the zoom panel, you can see the struggle to get back above the 40 WMA and could not. The interesting part about Vermilion is they have been ramping up in volume all year. Breaking the major trend line is never good. Horizontal support does not show up until $45. Ouch!
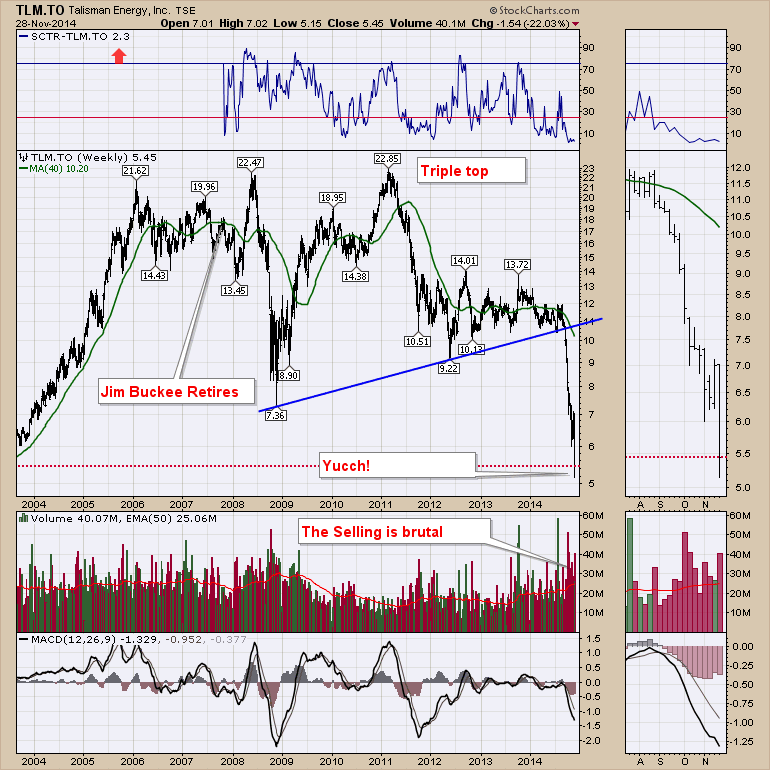
Talisman Energy (TLM.TO) is next. When this was run by a rocket scientist it was one of the most respected. When the imported management team took over, it seemed to mark a major top. It still ranks as one of the bigger companies but it has underperformed for a while. Oops, severe understatement! $22.85 in 2011 setting up as a failed triple top. If there is anything to learn from this chart it's to short the weakest stocks, rather than the strong stocks. The SCTR is at 2.3 which can only be described as bad. The worst news is it has spent almost all year as one of the worst with the SCTR hanging out in the '10' zone for a while. Look at the trend line break. Currently the stock is down 55% from the August level and 76% off the all time high! Interesting that the shelf around $11 for the last three years was 50% off the all time high. This is a stock with an activist investor involved who has lost 50% on his holding.
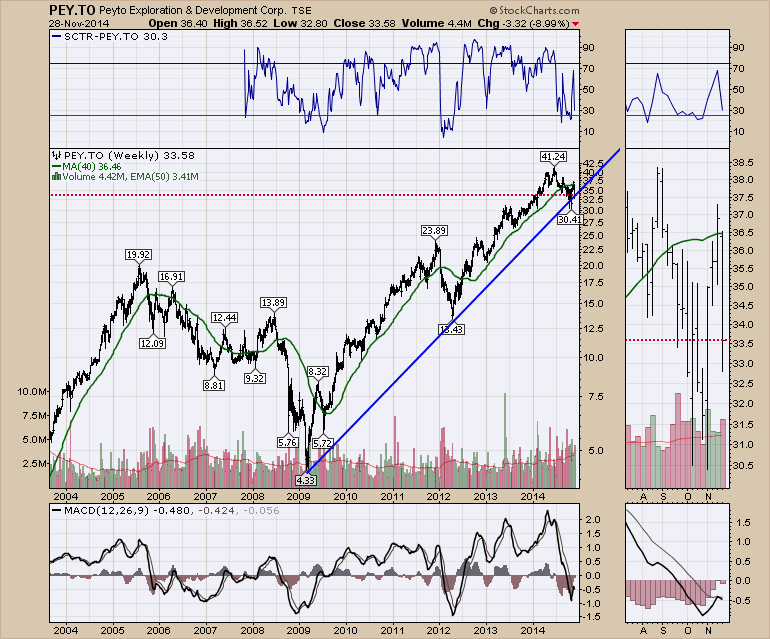
Looking for something with a little more optimism, Peyto Exploration (PEY.TO) comes in at #13 on the list. With an SCTR at 30% and the 5 year trend line still intact, Peyto can only be considered a standout relative to its peers. Looking on the zoom panel, we can see the stock tried to get back above the 40 WMA but failed last week. There is a horizontal support level at $30. If that does not hold, this could probably get crushed down to that $23.89 zone. While the volume has definitely increased it is not being sold off in panic amounts.
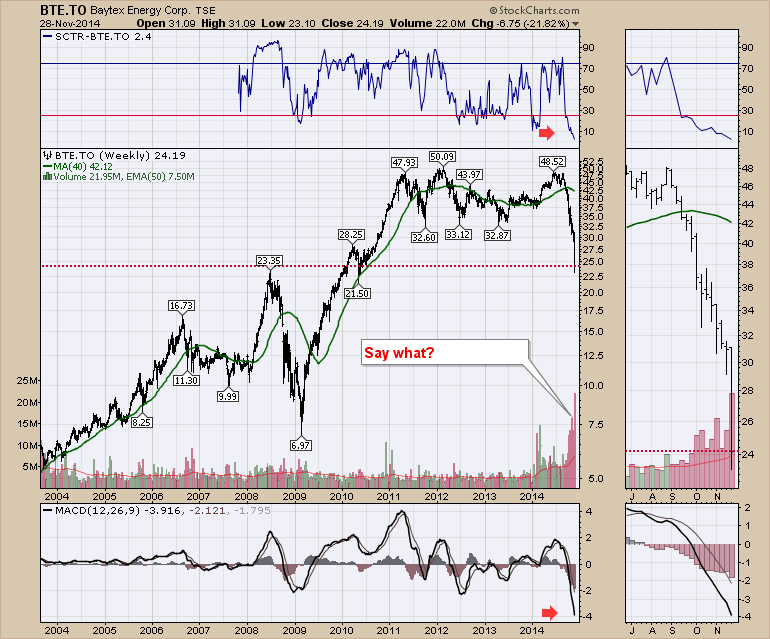
Next is Baytex Energy (BTE.TO). Baytex Energy has been trapped in a range for 4 years between $32 and $48. Well, here we are at 50% off the high at $24.19 ! This stock never even tried to break back above the 40 WMA. Look how controlled the volume has been for 10 years till 2014! This week had a volume 3 times the 50 WMA.... Talk about dumping the stock!!!!!! This price around $24 looks like a reasonable support area based on history and on what could only be described as climactic volume. We'll see if someone steps in to start to buy up this stock here.
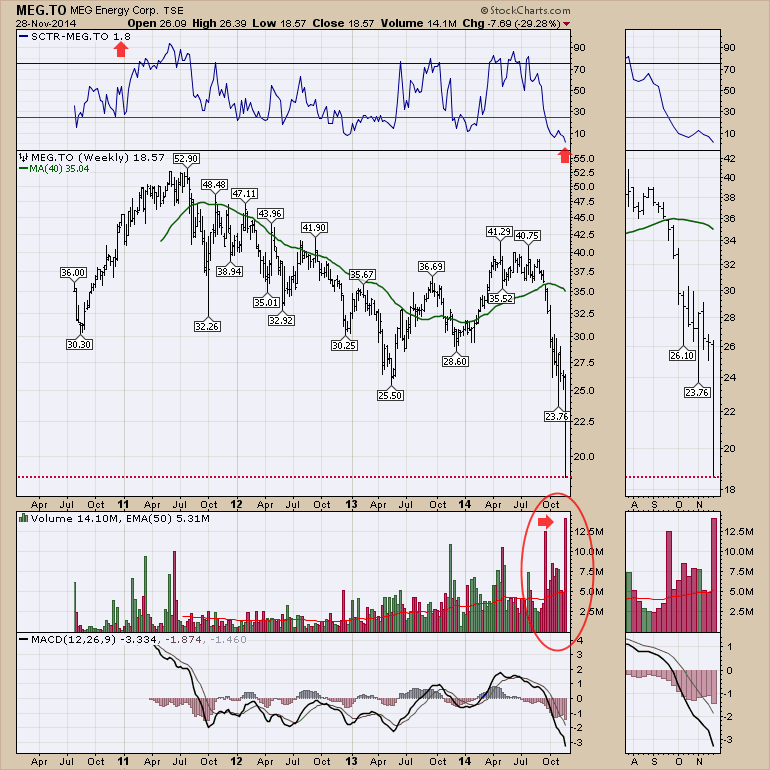
Number 15 is MEG Energy (MEG.TO). I was stunned when I saw this chart. This company has a field near the Christina Lake assets of Cenovus. In 7 quarters the company went from 32,000 Barrels/day to 76,000 barrels/day. Access to pipeline space is obviously impairing the stock. But this $40 dollar 'doubling in growth' stock in July is now $18.57... that can only be described as crushing! The SCTR is 1.8%, the stock is down 55% from the high. It is possible that the selling was cathartic this week?
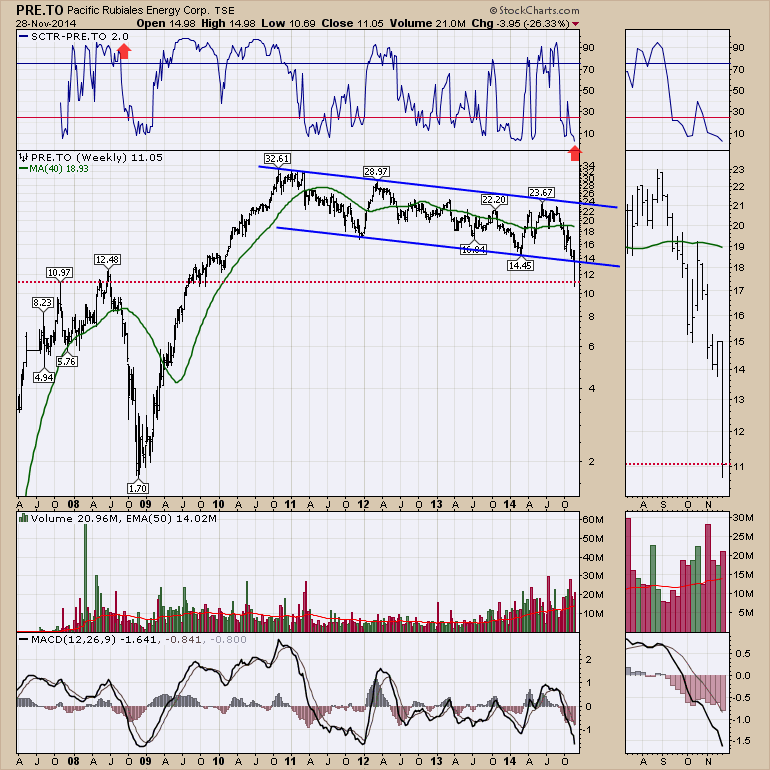
After crying over the MEG chart, I'll move along to the Pacific Rubiales Energy (PRE.TO). This stock has been down trending in a channel since 2010. With $23.67 as the 2014 high, PRE.TO has lost 53% so far! Looking back to historical, it looks to be at a horizontal support/resistance level. The downward channel screams avoid but now it is in huge trouble. The volume has been accelerating since early 2013. The stock went from $14.45 to $23.67 very quickly during 2014 so that was almost a double. But right now, this stock is in trouble with the down sloping trend accelerating.
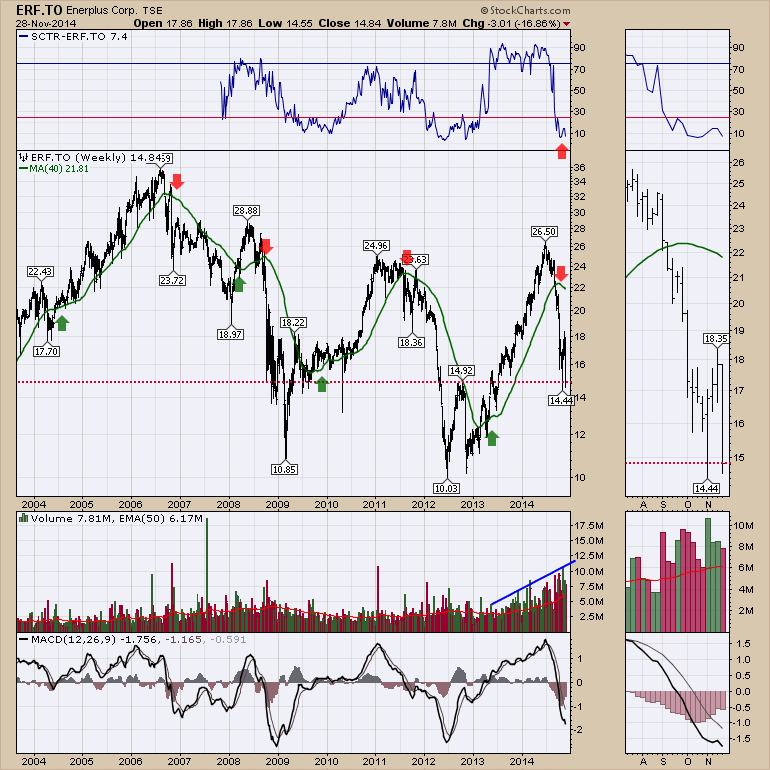
Okay. I am exasperated seeing all these crushing charts but we have a few more to look at. Here comes Enerflex (ERF.TO). Can we hope for something a little better? Actually this is a very interesting chart. Look at how well it is supported or resisted by the 40 WMA. To get less touches you could use a 50 WMA or a 65 WMA. The bottom line on this one is wait for a push above the 40 WMA. Some of these charts have had remarkable cliff drops on the MACD. Not a moment's notice before rolling over. The long run in the stock is a swing trader's delight. Currently it is not a buy. It's only down 44%..choke..choke.. You can imagine the management team is used to dealing with the boom - bust syndrome of the oil patch.
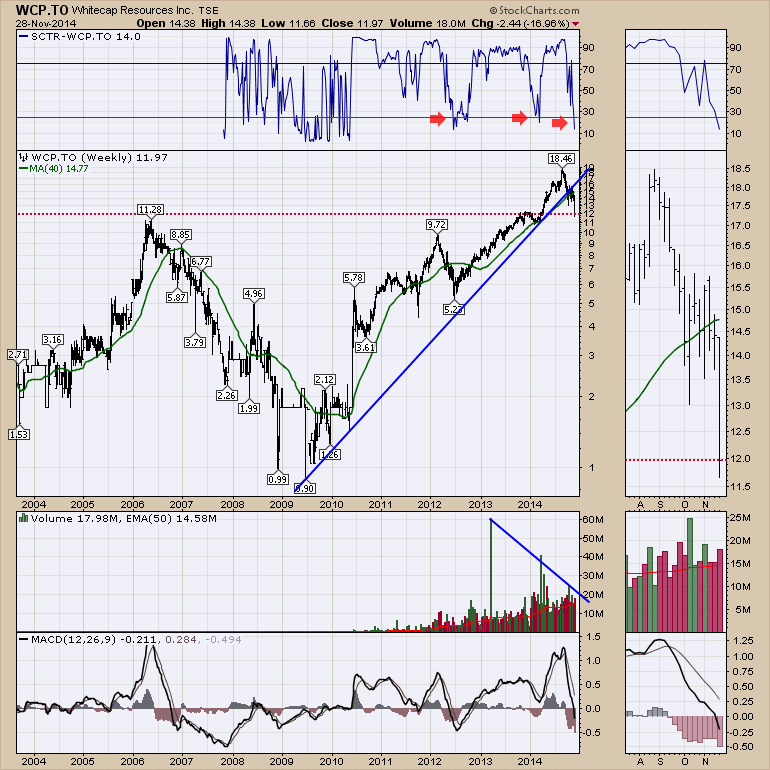
Here is Whitecap Resources (WCP.TO). The stock is up 2000% in 5 years. However, after hitting $18.49 in August, the stock is now down 35 % from the highs. This is an interesting place to expect support. The SCTR has plummeted to 14.0. We have just broken the 5-year up trend line. The volume has been climbing for the past 4 years. You can also see a down trend on the extreme volume candles. Bottom line, great stock on sale for 35% off.
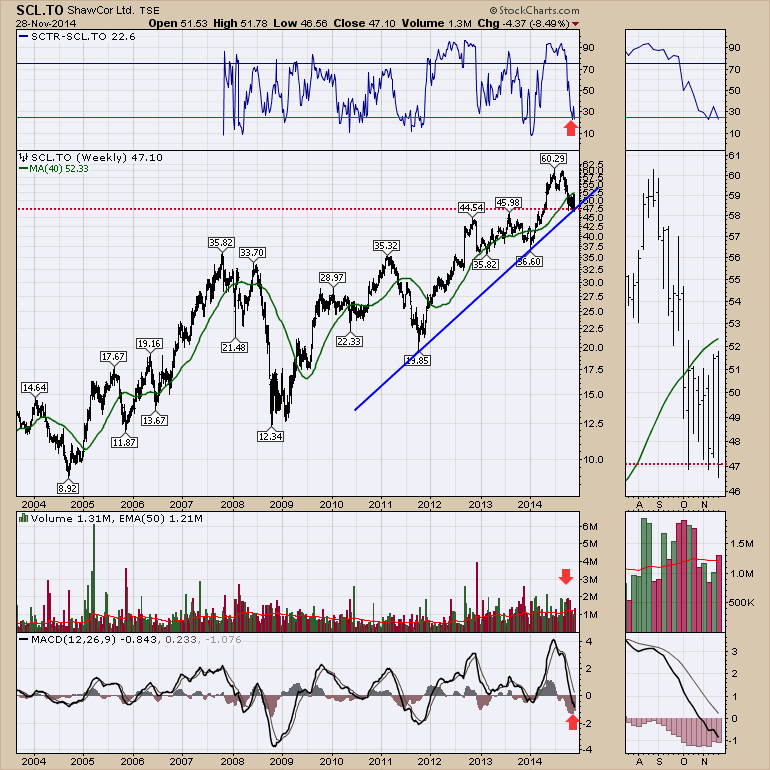
Number 19 is Shawcor (SCL.TO). This is an Oilfield Supply company that supplies coated pipe solutions. The 40 WMA is also a pretty clear support/resistance line for this stock. The uptrend is still intact but just barely. The volume has been running higher for 2 years and no real volume acceleration in light of the current price plummet in oil. With support at $46 this chart has held up well but it is below the 40 WMA It's an interesting chart. If we ever start building some major pipelines out of Alberta, this should also be rewarded by increased oil patch activity in the future once the pipes are flowing. With the stock only down 22% its resilience is impressive.
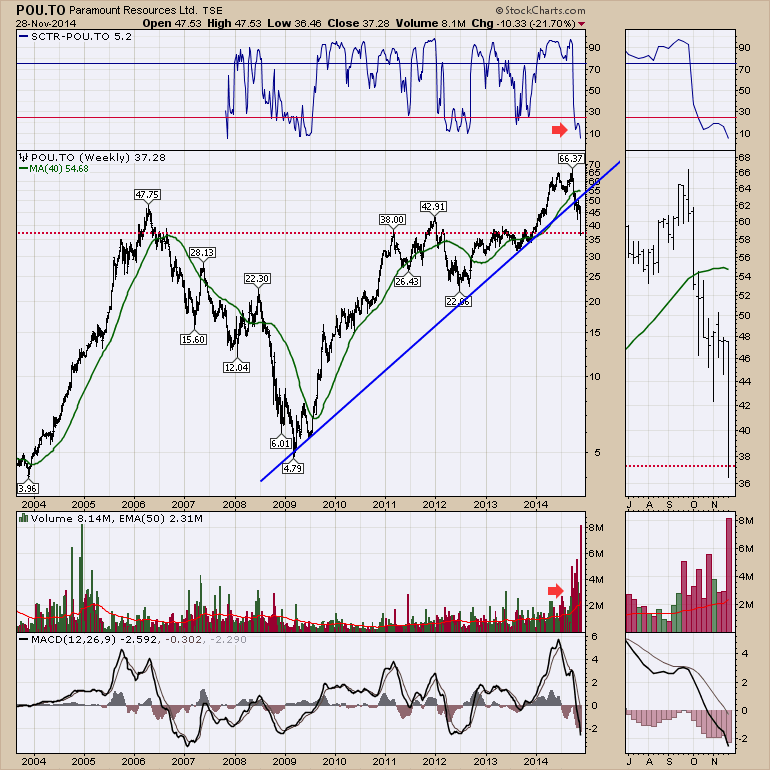
Precision Drilling would be next in the holdings but it is clearly decimated being down 50%. Here is the last chart I want to show and an interesting producer. Paramount Resources (POU.TO). It could still be considered as support right here, but we are definitely below the 40 WMA and the 5-year trend has been broken. The SCTR is down to 5% and the volume has exploded. Is this a washout volume yet? Price is down 44%. 6 of the last 10 weeks have volumes that are higher than any time in the last 7 years with this week's volume the largest in 10 years shown! Yikes!
Ok. That does it. If you are a bargain hunter, this could create a nice watchlist. You'll have to figure out when to enter, but it has been brutal so far.
Good trading,
Greg Schnell, CMT


