There is some Sentiment data that came in this week that reached new bullishness since 2000.
The Rydex Data and Investors Intelligence Data is available in the free charts on Stockcharts.com. Free users will not be able to expand the chart out in time so I have attached those below.
On the 'Free Charts’ Tab,
Look on the far right hand side under ‘Additional Reports'.
Click on 'DecisionPoint Chart Gallery’. Here is the hyperlink: DecisionPoint Chart Gallery.
There is a drop down box so you can see the data for different indexes. We are going to stay with the $SPX.
There are 4 hyperlinks near the top:
Trend Charts | Condition Charts | Breadth Charts | Sentiment Charts
Clicking on "Sentiment Charts", you can go to the two charts there that summarize an immense amount of data.
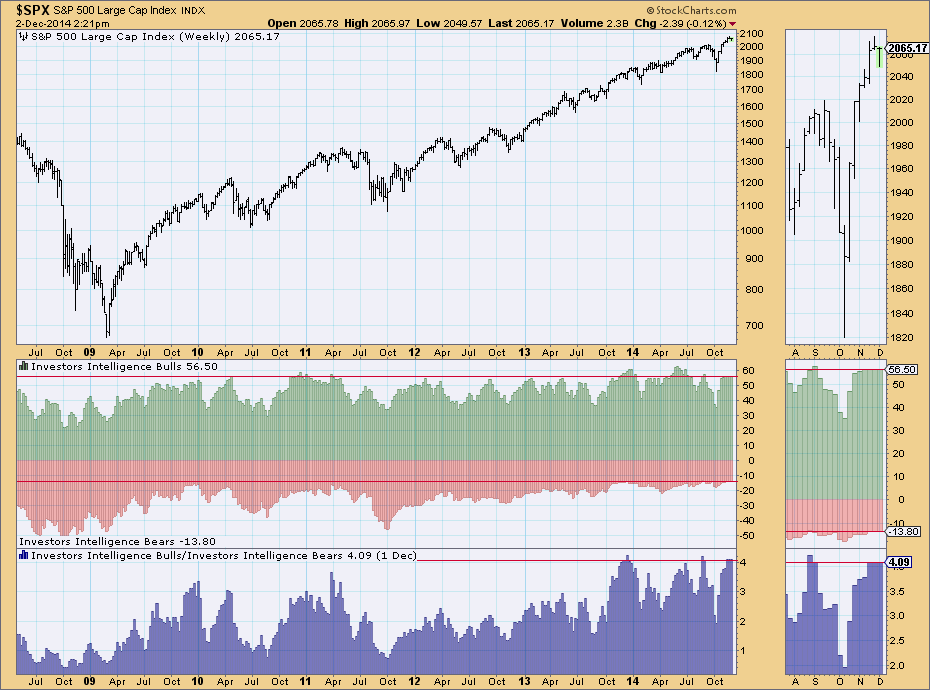
The green/red/purple data here summarizes the state of the "Investors Intelligence” which by all accounts looks to be "all in". I moved the Red line on all three charts to the current reading. We can see that they are at or near the extremes for the indicator but we have been here for a while.
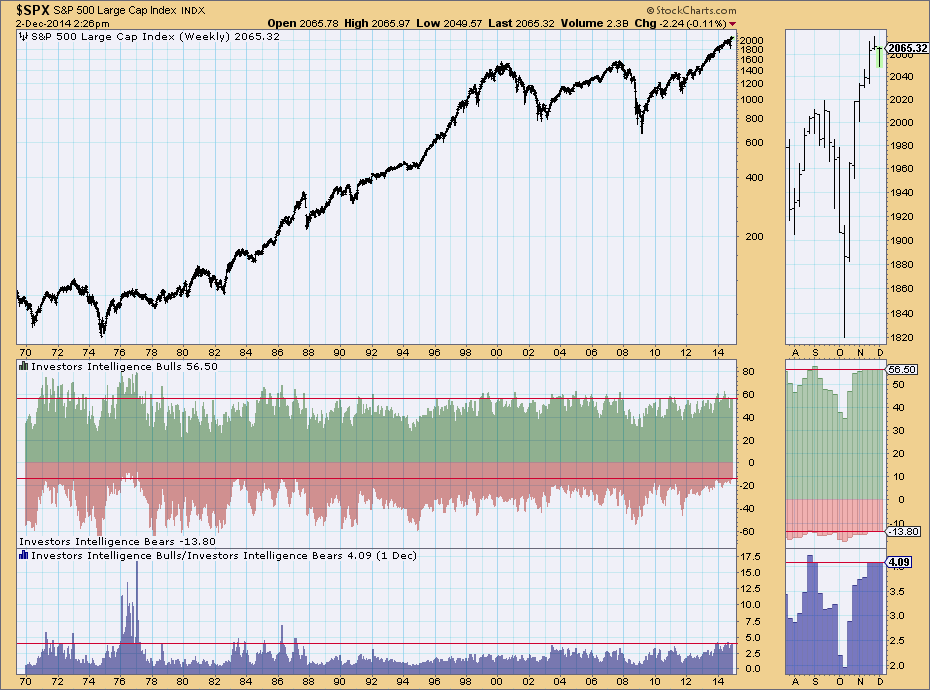
The chart I find interesting is the super long view of the same chart. I have posted it below with 45 years of data. It is possible to have a few more bulls, but the bears have been slaughtered with 39 year lows. The new low level of bears is now less than the triple top level through the 80's. I moved the Red line on all three charts to the current reading.
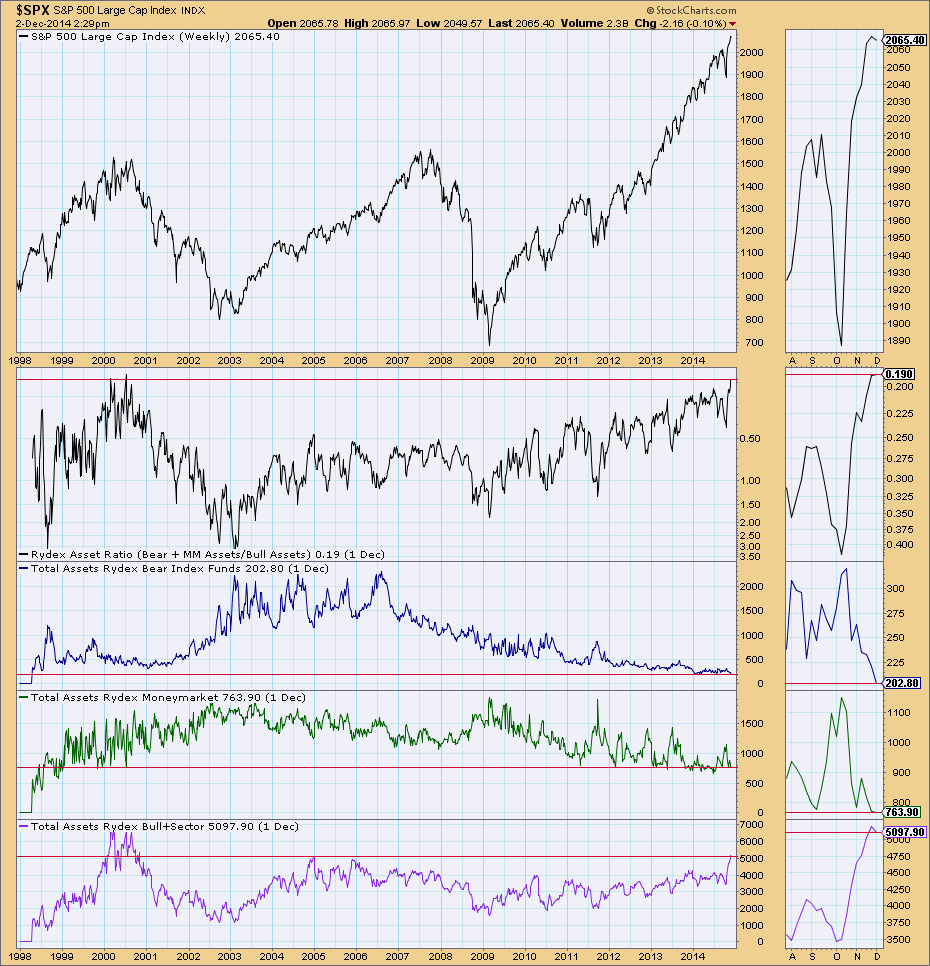
The Rydex data on the following chart only goes back to 1998. Just in case it’s not frothy enough, it looks like 2000 but we can push to higher extremes. This is measuring real money placement. The Asset Ratio is pretty much at the extreme. So many bears have never hibernated for so long. The Money Market fund chart is making a slightly higher low so far but we are at the extremes since 1999. As of this week we now have the proud distinction of having more money bullishly placed since the 2000 market top as shown in purple. That's a new high this week. Note the double top on the $SPX at March 2000 and September 2000. Note the double top on the $SPX at July 2007 and October 2007. Do we currently have a double top? No. Do we have to have a double top? It makes sense that all time highs get tested before you roll over but they never did on the Nasdaq in 2000.
Maybe it isn’t over till Canada? freezes over. Well it got down to -25 C (-15 F) last week and our Stampeders won the Grey Cup ... that must mark a top but I don’t have a chart for that.
I'll be reviewing the charts on this Thursday's webinar. I have a great one that helps with understanding the big picture. We'll look at that chart for sure but there are many more that are interesting. If you liked this article, feel free to forward it to investing friends and family. If you didn't like the blog, please send me a note on what I could do better. The charts are printable. They should also be clickable so that you can go look at the settings. When you do that, you can use the print command immediately under the chart.
We try to keep our articles informative and entertaining. Make sure you check out the other blog writer articles in Mailbag, Chartwatchers, Traders Journal, DecisonPoint, Don't Ignore This Chart, Chip Anderson, Scanning Technically, and The Canadian Technician. Subscribers have access to blog articles by Arthur Hill, John Murphy, and Martin Pring, as well as the DecisionPoint Tracker and DecisonPoint Reports. Don't forget to look for the subscribe button for RSS feeds and email.
On the Blogs tab, you can also see the Top Advisors Corner in the right hand panel where other technicians post their work. If you are paying for newsletters all over the Internet, don't miss all the articles here that are included!
Good trading,
Greg Schnell, CMT


