I have been writing about energy stocks declining for so long, maybe this is just a shot at trying to be optimistic. While preparing for the webinar last week and this week, Natural Gas jumped out at me because of the similar low to 2009. The base in Natural Gas is potentially setting up for a primary trend right shoulder. I also noticed the huge percentage gain in $NATGAS this week after Friday's close. Then to top it off, I have invited JC Parets to present to the Calgary Chapter of the CSTA in March. I was on his website on Saturday and noticed he had an article about $NATGAS. The stars are aligning, let's do a drill down. Let's look at the very long term chart first. For those readers who only buy 52 week highs, this is a little early!
Looking at the SPURS in purple, we can see that Natural Gas has trended down for years. We can also see that this is very low in terms of relative strength on this 20 year chart. The price chart is what caught my eye the most. Wyckoff did some tremendous studies on bases. One of the things he discusses is a final flush to get rid of weak hands. Well, $5 to $2.50 in three months probably gets the job done. Of course we never know if it is a 'final' flush till we get some time to the right of the low. The phrase Wyckoff uses for the final low is a 'Spring'. From this low it should bounce sharply higher. One of the problems with the base in $NATGAS is the $6 surge does not fit into the Wyckoff 'base' analogy. The price was only above the $5 level for 6 weeks through a 250 week base so perhaps we can call it an outlier.
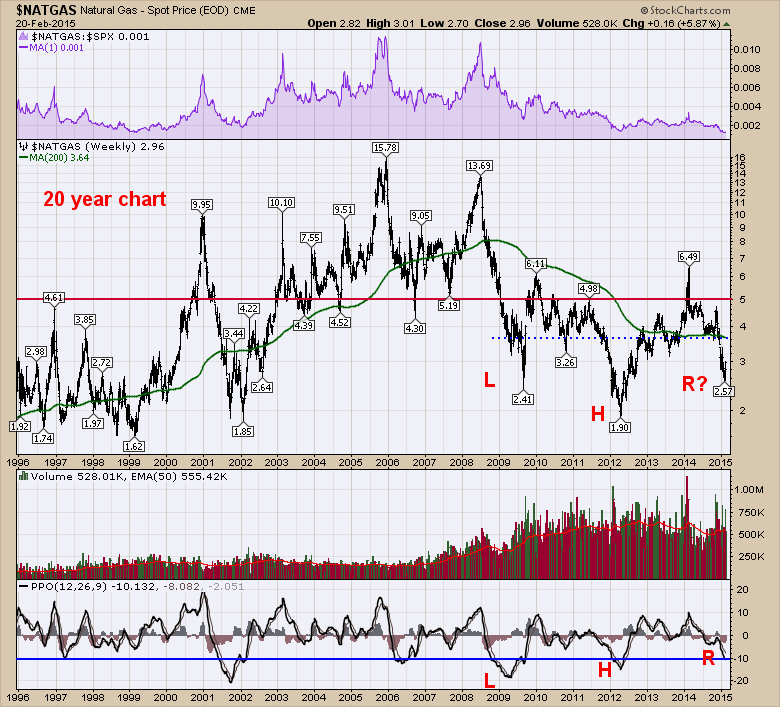
We continually talk about the marginal cost of production for Natural Gas. One of the numbers is around $3.75 so I have placed a dotted line there. Most of the price action over the last four years is above that $3.75 level. The exceptions are shown as the left shoulder, the head and the potential right shoulder currently under construction. $2.57 for a low is very low if you have been following the articles about gas and oil being below the marginal cost of production. With the left shoulder down around this level, it can make sense to expect a low in a similar range. I will discuss volume when we zoom in a bit, but we can see $NATGAS is very heavily traded since the financial crisis. My final indicator is the Percentage Price Oscillator (PPO). We can see a level of -10% is pretty extreme. This will be the 6th time in 20 years getting to this level of downward momentum. Just a glance on that indicator says roughly every three to four years we get a major low. 2006, 2009, 2012 and now 2015 would all be three year cycles. All of those lows were made in the first half of the year. In three of the cases, price went on to make a lower low, so this 'right shoulder is done' might be premature...
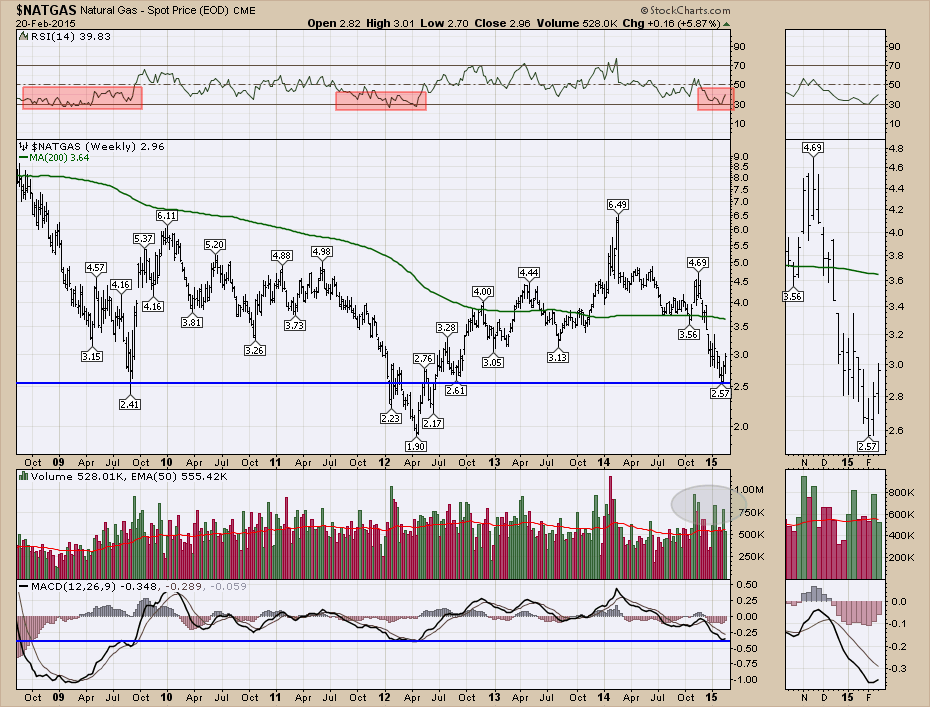
Zooming in on the last 6 years, the chart becomes clearer. The RSI is trying to bounce off 30. These levels are pretty extreme in price. The low of $1.90 back in 2012 was very very low. The price action was pretty much straight out of the hole from there. I have highlighted the recent volume surges with a shaded ellipse. These surges are about 30% above average so there is buying volume near this low. Finally the momentum marked by the MACD is showing a very extreme level already even though the price is not at 2012 levels.
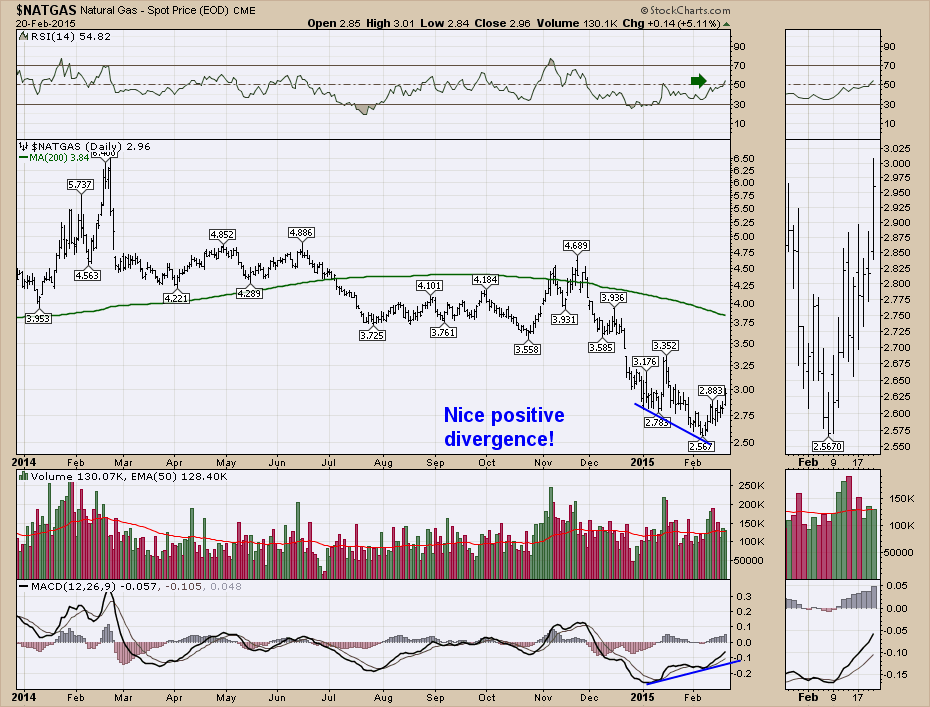
We'll keep drilling in (pardon the pun) to the daily, to see what is really going on. Ok. This is looking promising. The RSI has pushed above 50 for the second time since making the 30 level low (on the RSI). I like that positive divergence on the RSI. The positive divergence on price compared to the MACD is nice to see as well. We can see the volume for the last few months is much higher than the summer of 2014. The recent volume surges since February 1 are interesting. There was no cathartic volume flush on the lowest low so far. Usually we like to see people throw in the towel and hit the sell button with a major thud. The volume since the low has been impressive.
Technically, with the momentum washouts on the daily and weekly we could be looking at the final low. The next tell will be what the E&P (exploration and production) natural gas stocks are doing. First, let's zoom in through the RRG Chart.
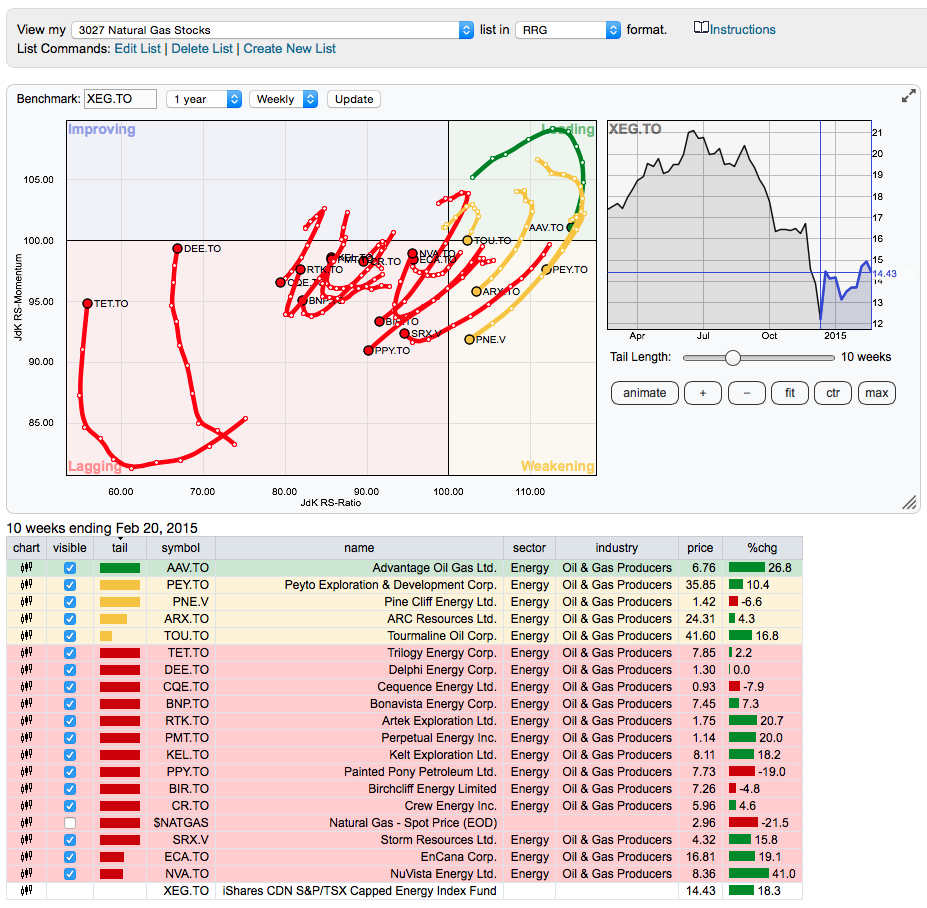
What a beautiful chart!!!! On this chart, I have compared a bunch of the Canadian natural gas related stocks to the price of $NATGAS. You can see in the top left, I have made the benchmark $NATGAS. You can also see a graph of the benchmark on the right. I spoke with Julius De Kempenaar last week and discussed another group of stocks that was surging like this. He suggested that is no coincidence but a real move by the industry group. In this case, it would appear to be fabulous timing that these are all pointed towards the northeast. This looks like a squadron of snowbirds heading towards a flea market in Mesa.
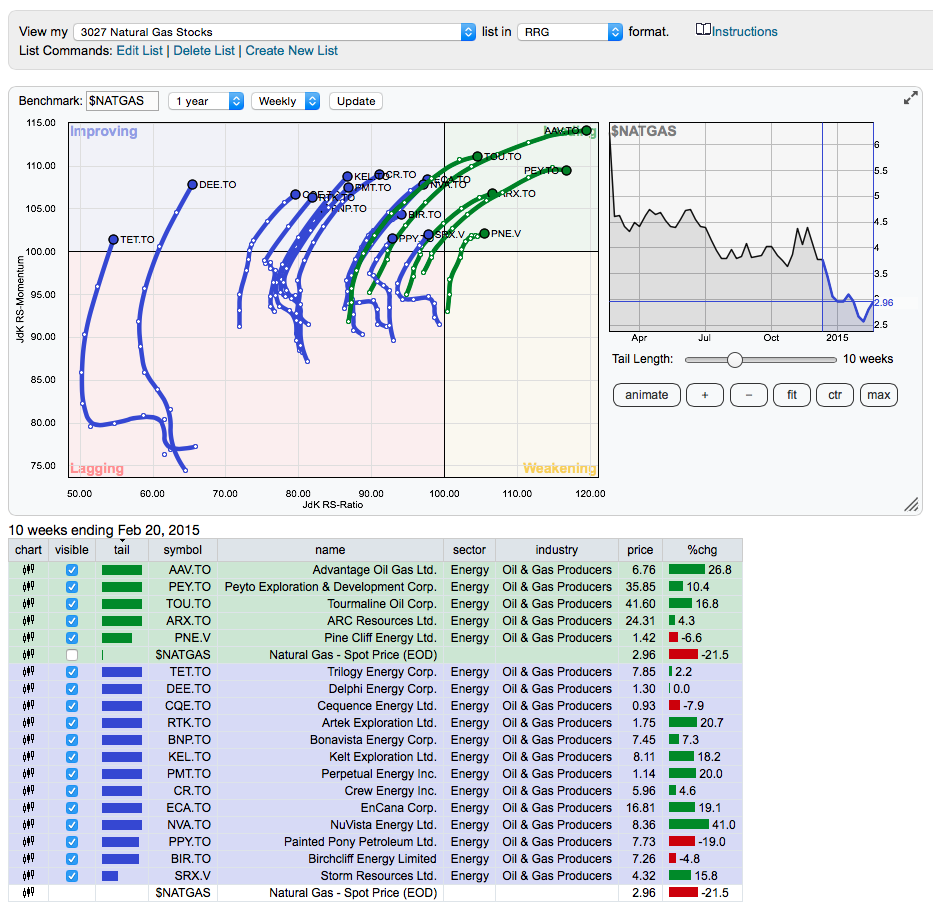
Because the price of $NATGAS has been falling, these stocks are outperforming if they just stop going down while $NATGAS keeps descending. But investors are going to move money towards the group when the related stocks start improving compared to their sector or a broader index. We can use the Canadian energy ETF (XEG.TO) to compare to the sector or $SPTEN. Either one will work. XEG.TO is tradable so we'll use that one.
What a difference that makes. Most of them are in the red zone. While that doesn't make them great yet, let's talk about the chart. The last name on the list at the bottom is XEG.TO which is our benchmark. We can see that over the last 10 weeks it is up 18%. Looking up the list we can see a few stocks with gains greater than that. I personally like stocks crossing from red to blue when their patterns match technical analysis breakouts from bases. We can see some of the stocks are already moving down from green to yellow. This might mean they had an early initial surge (pushing them through green) compared to their peers but now the peers are catching up. Interestingly, at this time, all four in the yellow zone have under performed the benchmark over the last 10 weeks.
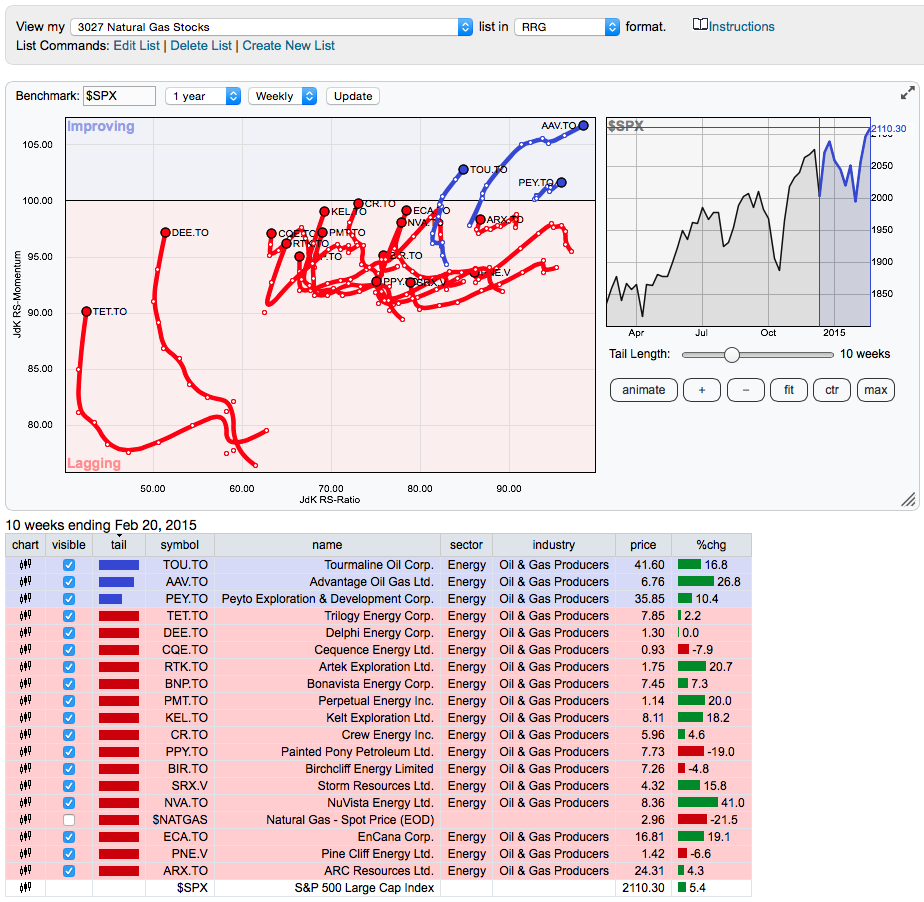
We can see some of the stocks in the red zone are really starting to make impressive percentage gains off their lows. The real issue will be starting to outperform. Let's take one more look at something like the broader $SPX. I don't like to use the $TSX as it is so heavily weighted towards energy that it moves with the energy stocks. The $SPX is so broad it is a stable benchmark.
Now this is very exciting. Lots of these have vectors pointed towards the northeast. That is very bullish. Here again, we see the broad group starting to turn up as well as move from the left to the right. This means they are starting to improve from their underperformance compared to the benchmark. It takes a sustained period to get to the right side of the centre axis. The fact that this group is huddled just below the blue zone and turning up together is very bullish. As soon as they start to gain momentum compared to the index, they should attract more investor interest. It's not bad to start stalking stocks as they get a little surge in energy. You don't want to be buying them at the end of the move.
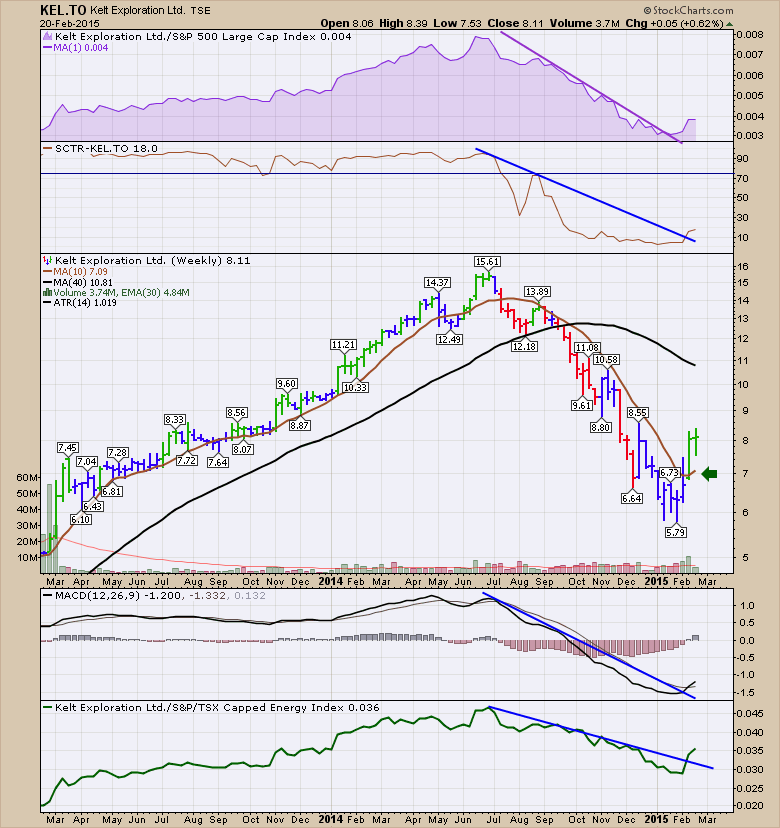
With the above list, you can make your own chartlist with these companies in them. You may have already generated a Chartlist last spring when we covered off a group of Canadian Natural Gas stocks accelerating then. I have pulled out an example stock from the list to give you an idea of how this looks as they start to go above the red / blue line compared to the $SPX. The example is KEL.TO.
They are not all this pretty, but you can decide where you like to buy these breakouts when they happen. Here is Kelt Exploration (KEL.TO)
Good trading,
Greg Schnell, CMT


