Is this a new Canadian Bull Market? I took a field trip to Water Valley and had lunch in the only restaurant in town, the Water Valley Saloon. Yes, when you're west of Highway 22, you can literally step out of anything modern and arrive at the 1920's. I found it so interesting that they had bull moose horns on the same wall as a black bear skin. Much like the market, pick your view! Water Valley is a special location because of the stunning beauty of the rolling foothills in front of the Rocky Mountains, It has also been a hub for old oilfield reservoirs that are being drilled out with horizontal drilling. The restaurant was pretty quiet. There were only 4 oilfield service people having lunch which is very slow for the restaurant. I didn't see any oilfield trucks on the 1 hour drive either direction. (I did see logging trucks though!)

So that brings me to my next question that I am trying to wrap my head around. After my series on Market Manias, when one industry collapses, we see the effects slowly roll through other industries one by one. Now that oil has had a bounce, I expect some of this oil run up to unwind. Currently, some stocks are making higher highs, but others are letting go already. So let's roll this around to the banks.
All of the Canadian Banks have interesting charts this week. So why am I correlating the banks with the Water Valley Saloon? Well, they have been loaning money into one of the largest capital investment regions in Canada through the oil companies. Hidden in the heart of that investment, has been the wild west location of the new technologies in old reservoirs and the new developments in the 40 year old oil sands. With very little growth in Canada that was not on the back of the growth in oil, the banks were happy to invest in something that has such regular demand. I wonder if the slow down in oil will start to affect the banks' balance sheets as well as their future growth opportunities? I would encourage you to look how the 2007 market top developed in the mania series. That article can be reached through this link. 2007 Market Mania. Remember the housing stocks topped at least a year before the banks. Below is a chart of the US industries as the top unfolded.
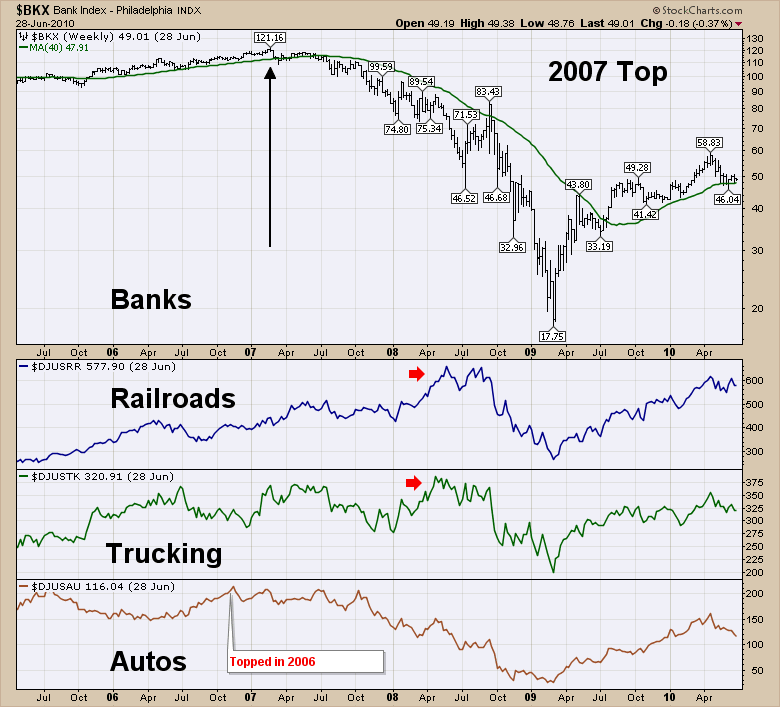
That first plot was the picture of the US banks. How about the Canadian Banks? Below is the 2007 top for 4 of the banks. One of the important hurdles for the banks is trying to get back above the long term average of the 200 DMA or 40 WMA. When you look at the chart below, notice how the 40 WMA was a resistance area throughout the downturn. You may also remember that the oil stocks topped in April/May 2008. The $TSX topped in early June 2008.
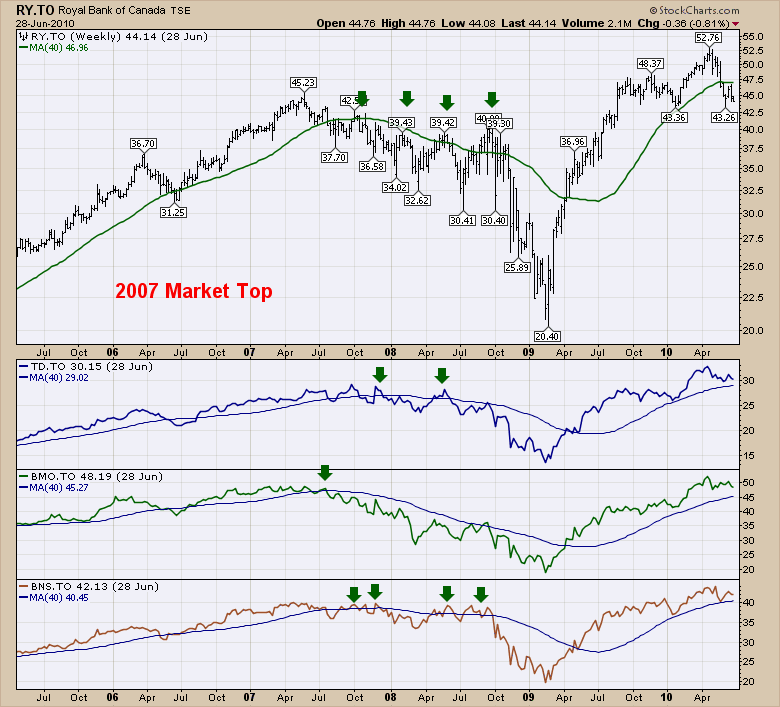
OK. So the 40 WMA was resistance. That is the history but why is it important today?
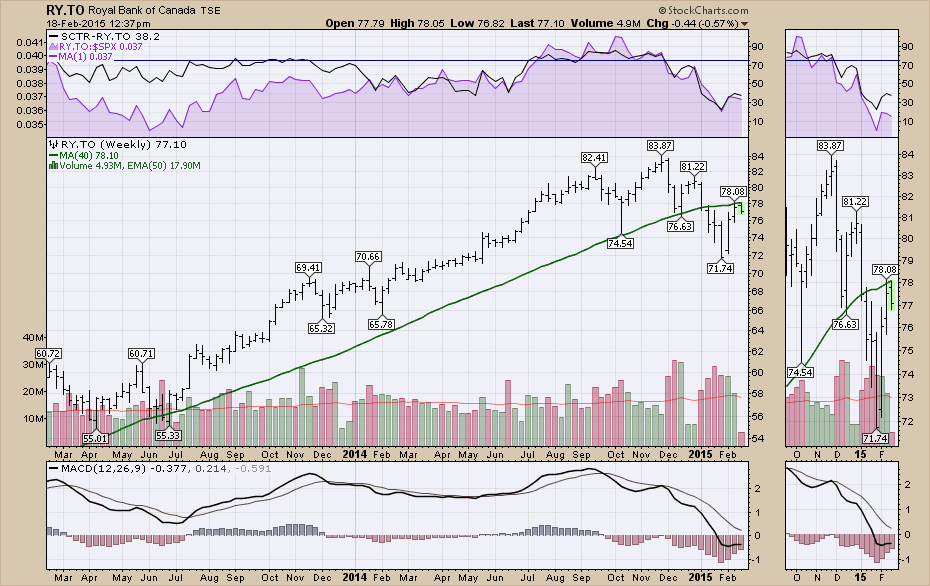
Let's roll through our Canadian Bank charts. We'll start with Royal Bank (RY.TO) or RY, otherwise known as RBC. We can see it has spent last week and this week trying to get through this area.
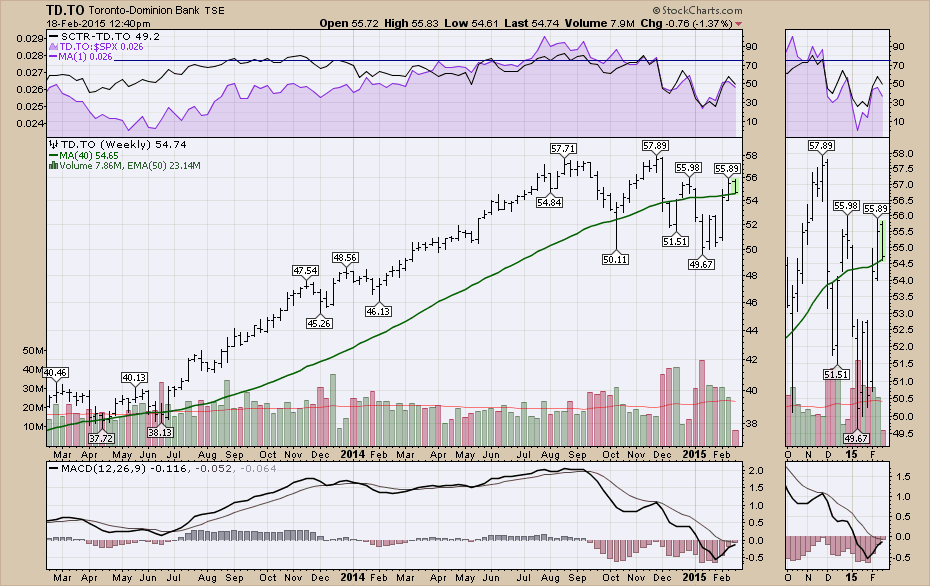
Here is Toronto Dominion (TD.TO) or TD. You might also know of them as 40% owner of TD Ameritrade or 100% TD Canada Trust. Back to testing the 40 WMA.
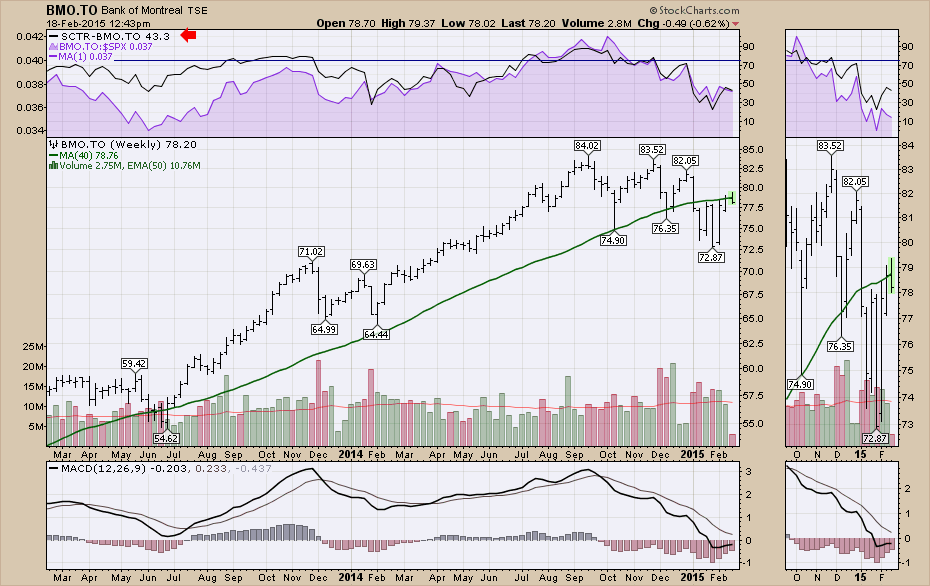
Here is Bank of Montreal (BMO.TO) or BMO. You may know of them as BMO or BMO Harris.
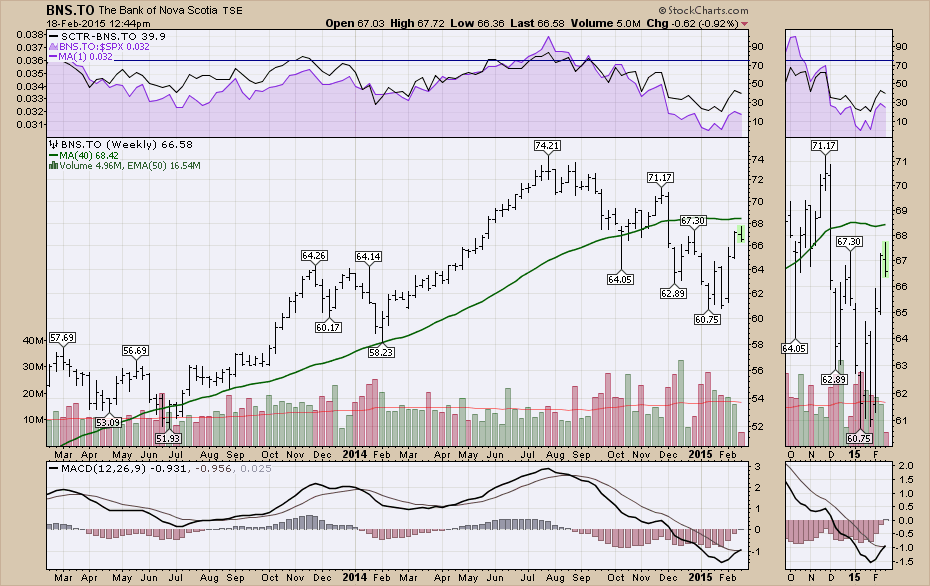
Here is Bank of Nova Scotia or ScotiaBank (BNS.TO). US listing is BNS.
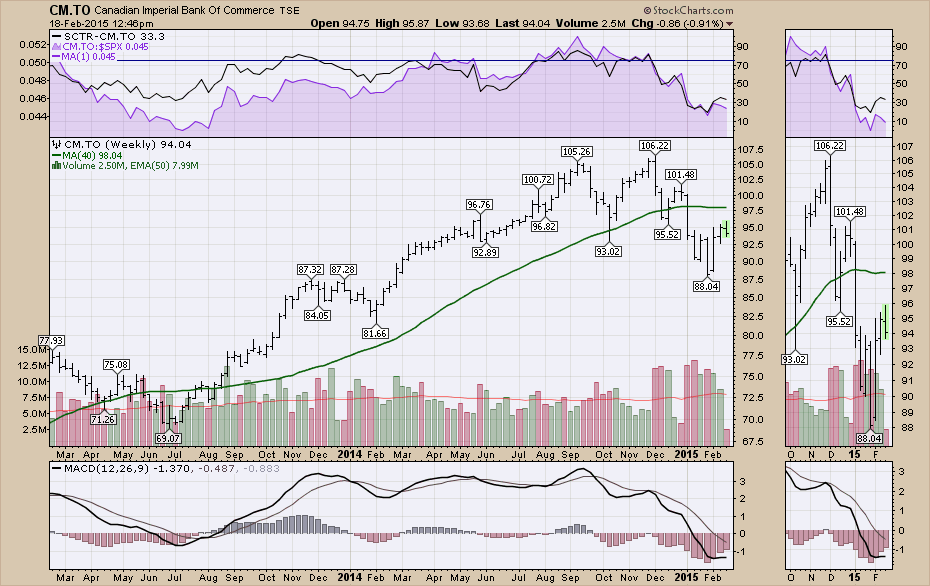
Next is the Canadian Imperial Bank of Commerce or CIBC (CM.TO) or CM.
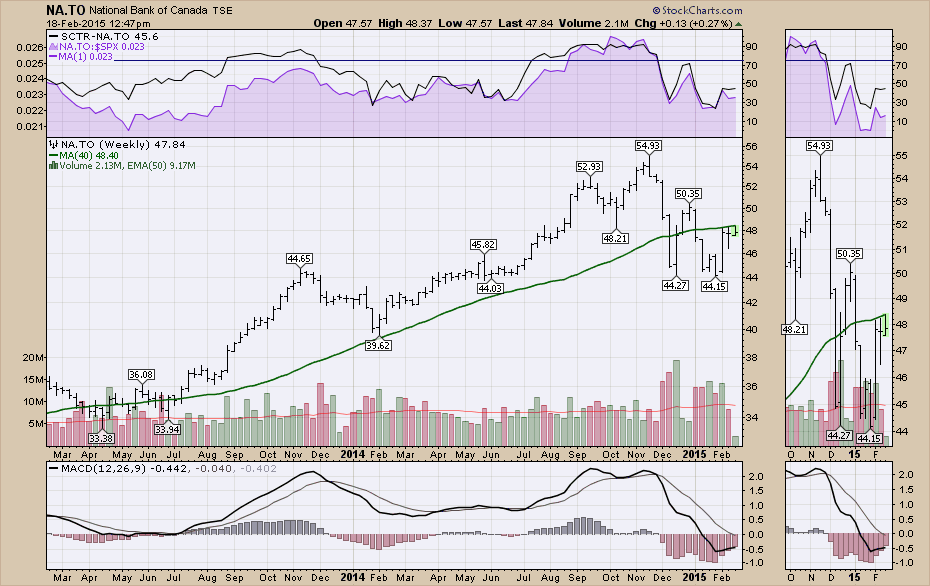
National Bank (NA.TO) is a reasonable size bank in Canada. Three weeks trying to get back above.
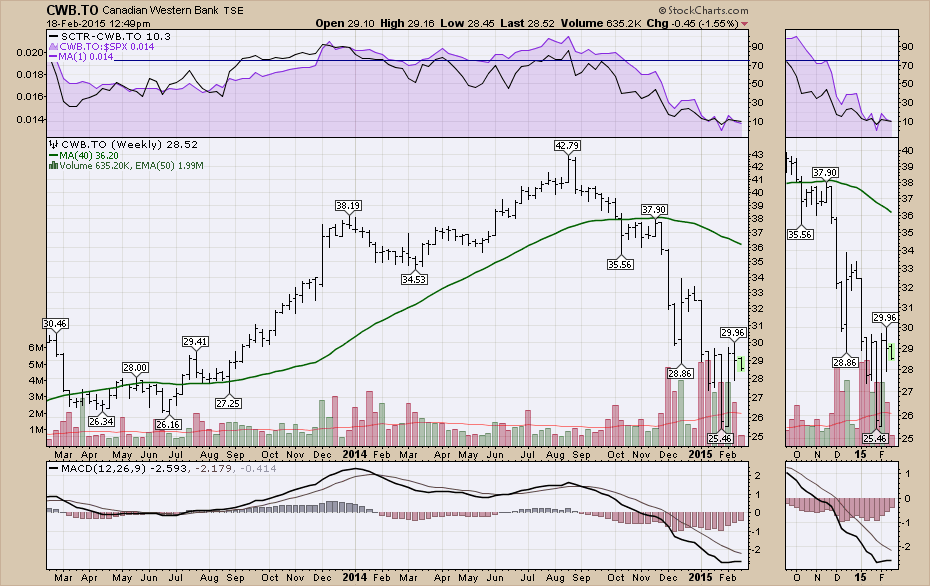
Lastly, a smaller regional that is Alberta centric. Canadian Western Bank (CWB.TO). This clearly has the flight path of oil stocks written on it.
Now we can summarize this. All of the banks are now testing the 40 WMA. If we have trouble staying above the 40 WMA over the next 2 months, I would be a little more cautious.
In general, I am a Canadian bull (ala the moose!) on the broader markets worldwide. With new highs breaking out all over the world, it makes me much more bullish. On the negative watch is the upcoming jobs data for the first Friday in March and the first Friday in April. That is when we should start seeing the effect of oil patch layoffs. How the markets react to those unemployment numbers will be very important. As the oil business is global, we should see the jobs pull back worldwide. The question is can the central bank easing from Japan and Europe continue to push through the weakness? China is the great unknown, but the weakness there is important to monitor. There is always something to worry about but new highs are very bullish. Weakness in banks would be a bigger clue that this bullishness might unwind with the trigger being the unwind in the oil business. The chart of 2007 above pointed to the banks breaking down below the 200 DMA or 40 WMA before the market top was in. Rick George, formerly Suncor's CEO, thinks this oil patch slowdown will take 4 years. Interestingly, that is the same sort of time that the market mania series pointed to (5 years) as well as my analysis of the US dollar bull trend. He probably has different measures, but I like that he is on the same side of the time scale as I am on. I do not expect a quick recovery for the oil industry. As an Albertan, I hope I am wrong.
This is also an important week for the US markets, They really need to hold the breakout above the prior highs for 2 weeks. Failure to do that would add a lot of caution, but until proven differently, new highs are bullish! If we are proven wrong, I'll just move the camera a little higher on the Water Valley wall.
Good trading,
Greg Schnell, CMT


