This article continues where How I Use the StockCharts.com Home Page Part 1 left off. You can access that article here.
Let's go back to the Golden Line. I want to dig into the SCTR rankings. To me, this is the single most useful method for identifying strong stocks. I find it stronger than many of the other systems. It does not reflect any fundamental valuation metric. It simply measures price movement in the stock. All of my poorest trades result in using any fundamental analysis. As soon as I get involved fundamentally in a stock, I let pullbacks become problems. I find SCTRs to be way more powerful for finding the best.
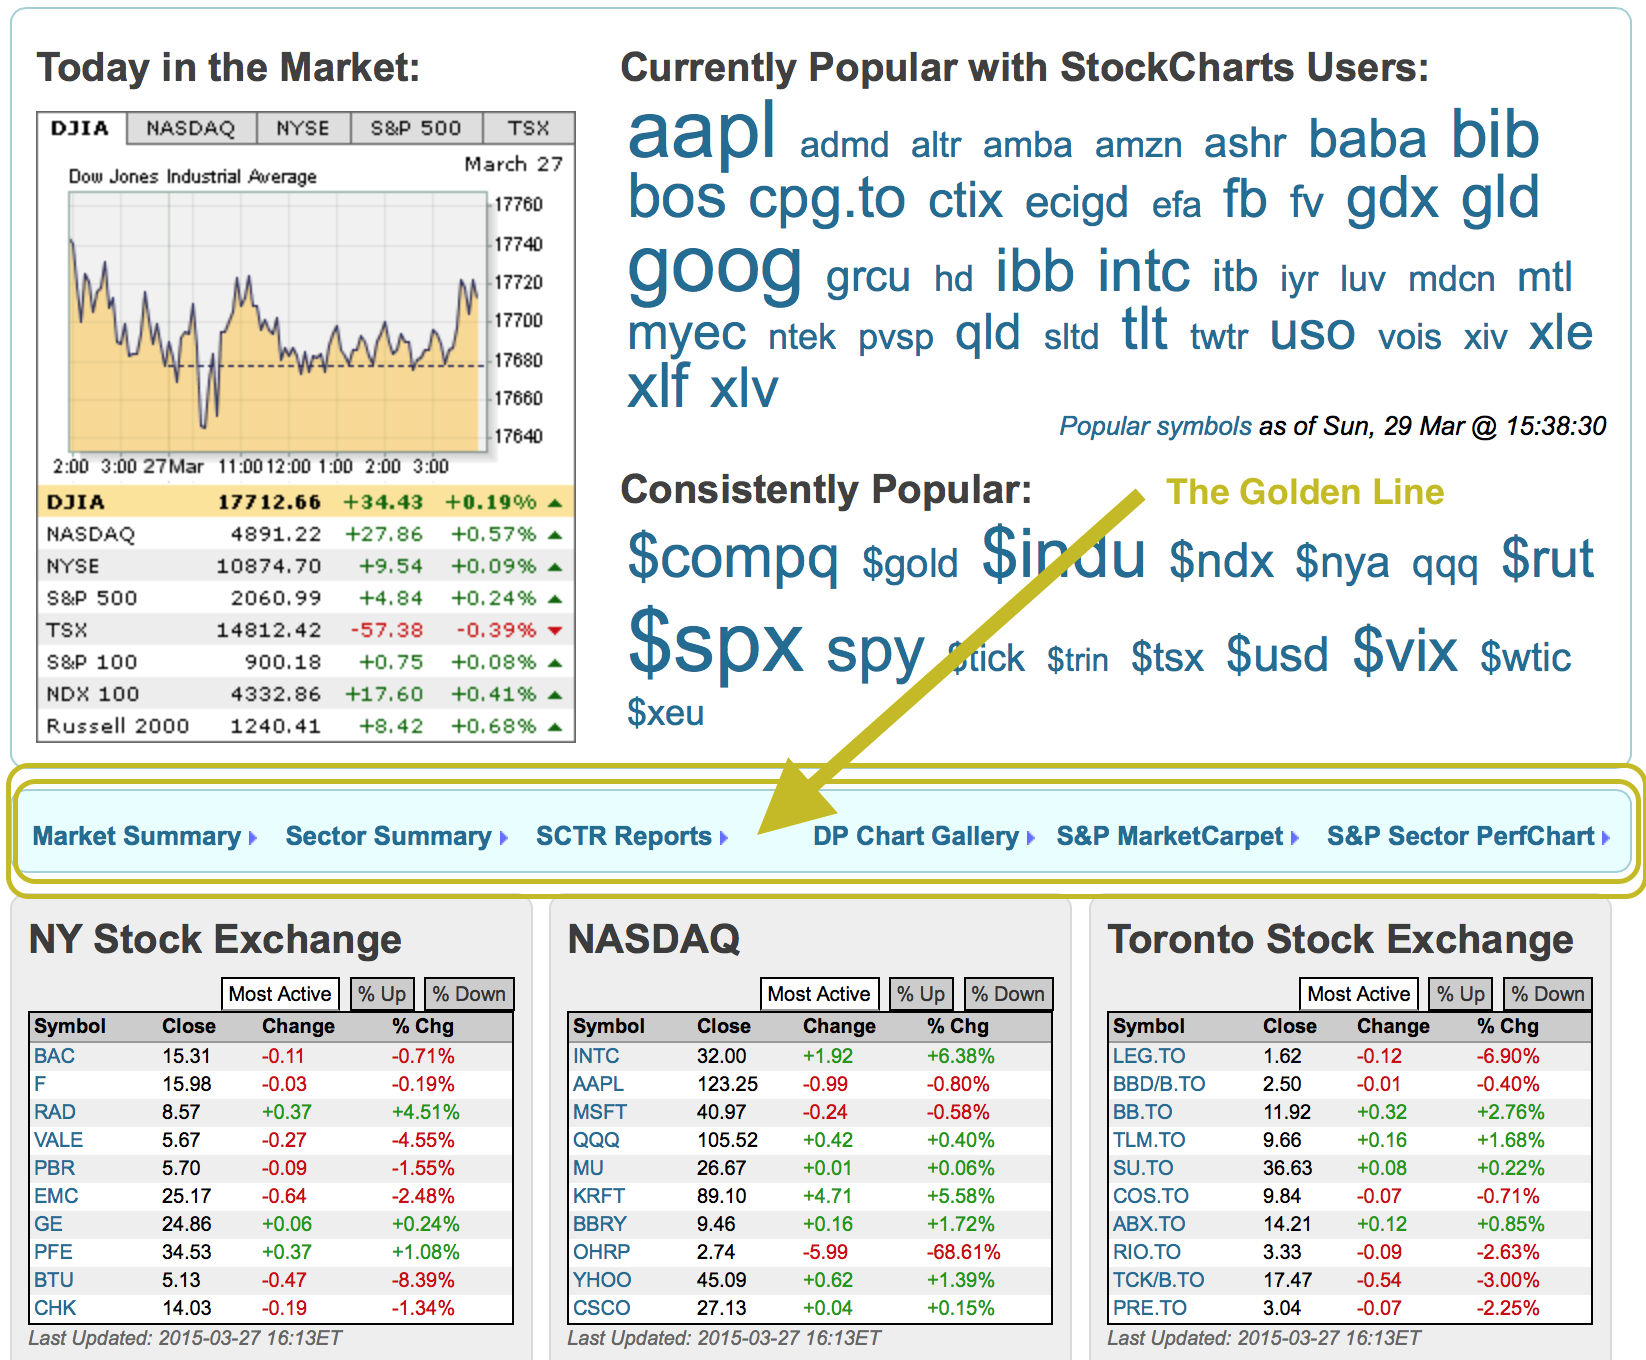
So let's dig in to the SCTR Reports. For Canadian investors, this is one of the best tools to rank Canadian stocks. When you start the reports, it is important to notice the drop down box at the top to select your favourite tool. If you are not sure of what is really strong at any time, find the stocks behaving the best by ranking them in SCTR rank regardless of industry or sector. Again, the SCTR does not change based on intraday, daily, weekly or monthly, so the second drop down box is not as valuable on this page for the static value. However, you may want to find the fastest moving SCTR's intraday or end of day depending on your timeframe. I left it on intraday in the current example and I have sorted by volume to demonstrate that all the columns are active. Canadian investors can select the Toronto stocks for the Canadian rankings.
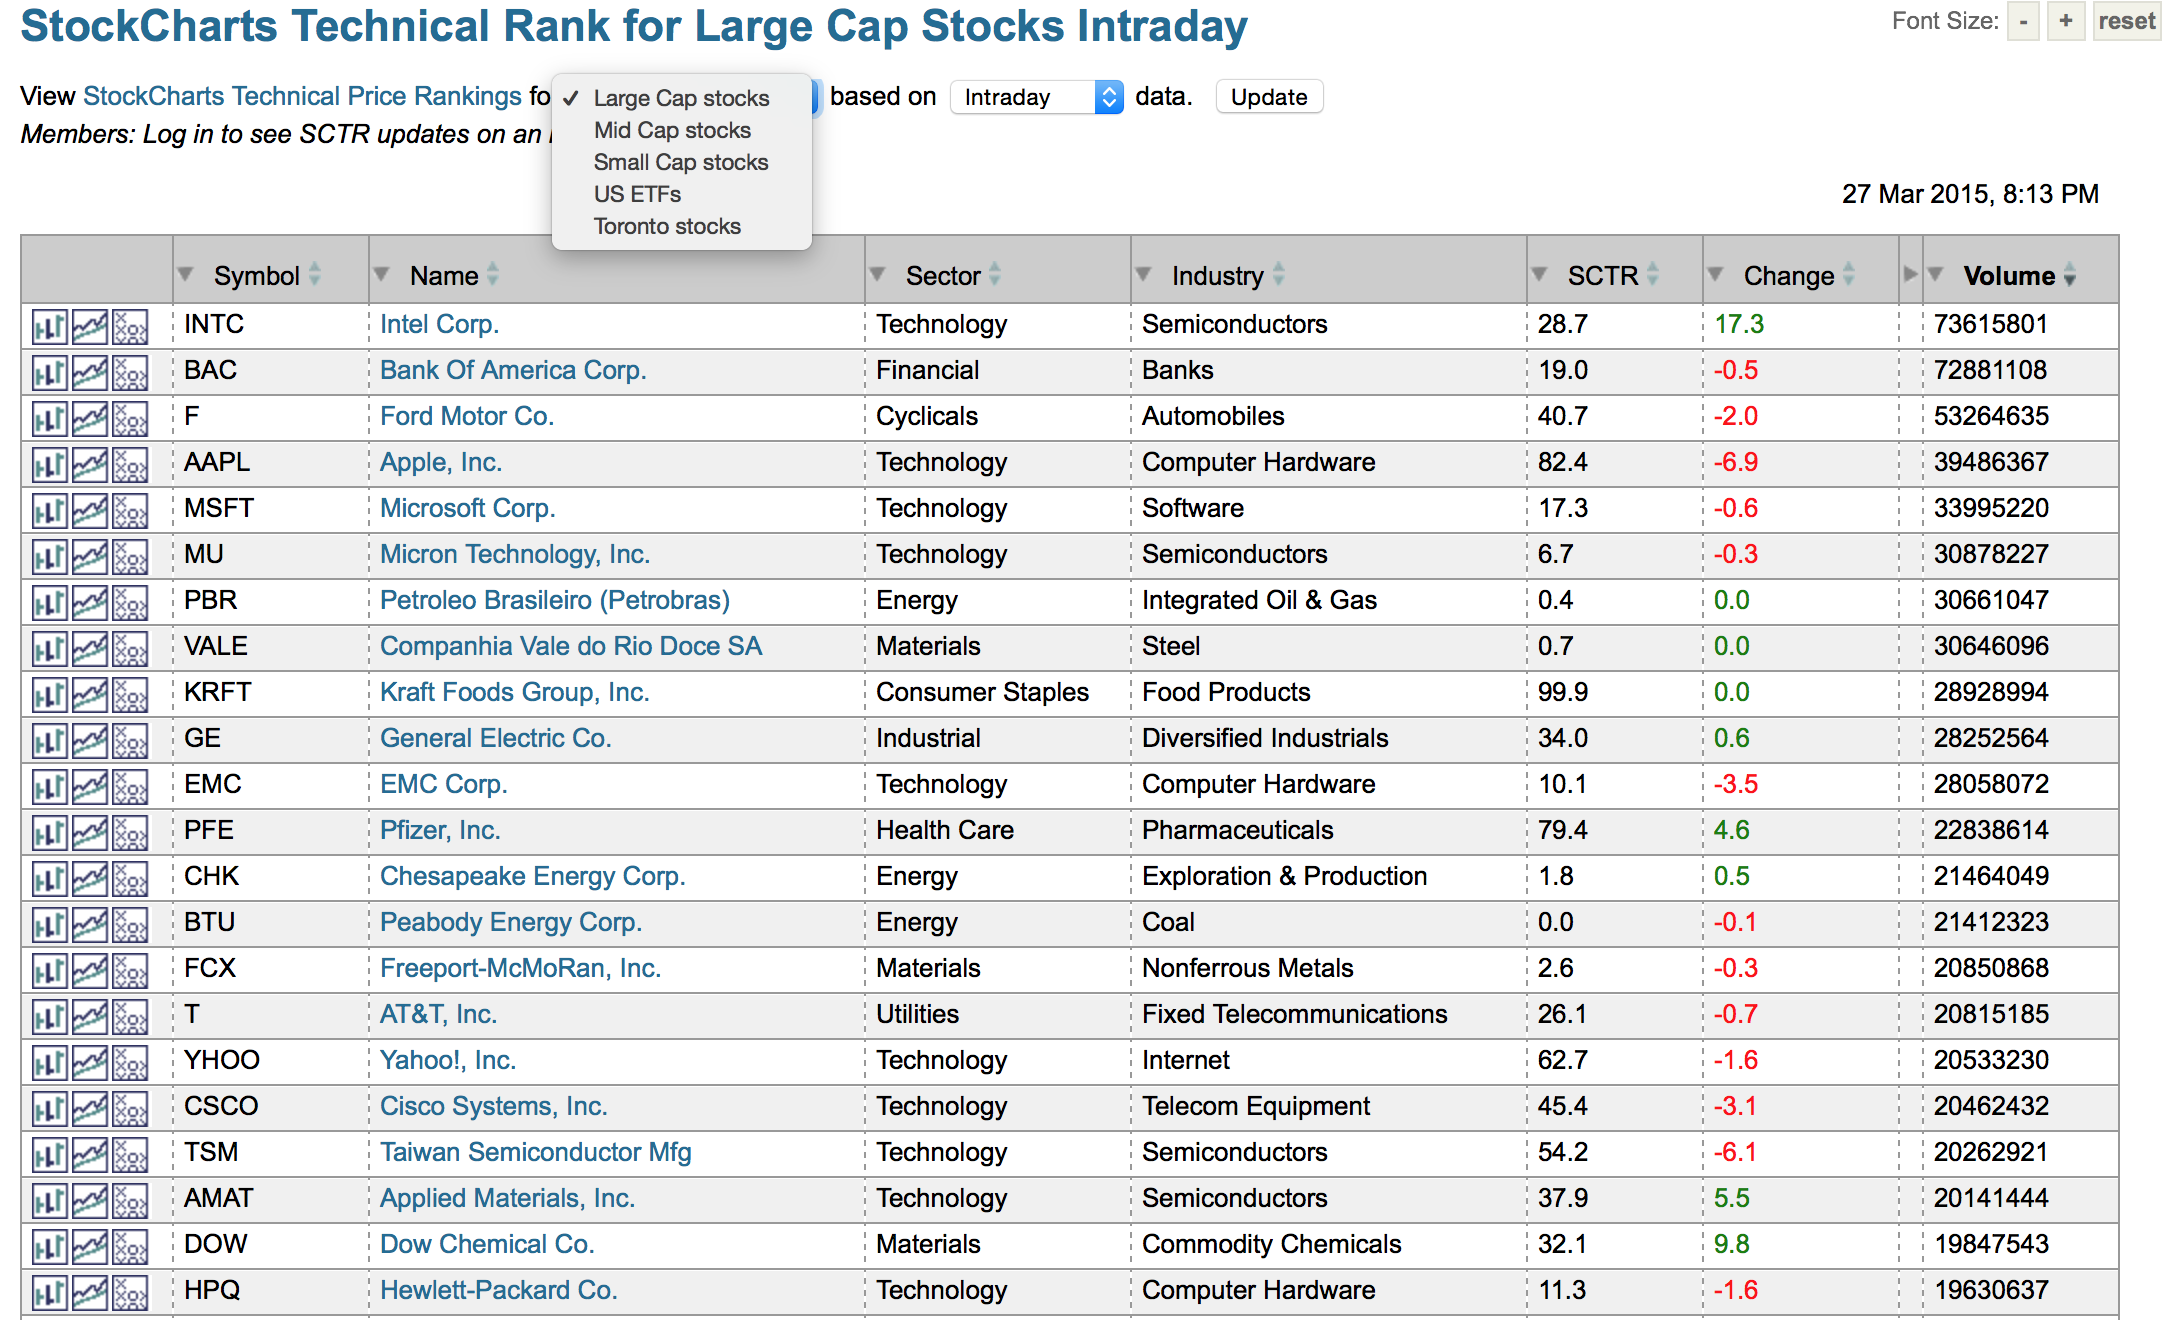
The best is that you can sort by SCTR just to see what is strong. Clearly, in this Canadian example using Toronto stocks (Venture exchange stocks are not included), you can see that the strongest stocks in Canada are Health Care stocks. A 99.9 SCTR means the price action is better than 99.9 % of the Canadian stocks in this example. You will also notice in the Canadian sort, all market caps and ETFs are included. This is very different than the US sort but you need enough stocks to make the sort group valuable. In the Canadian case, this works out well.
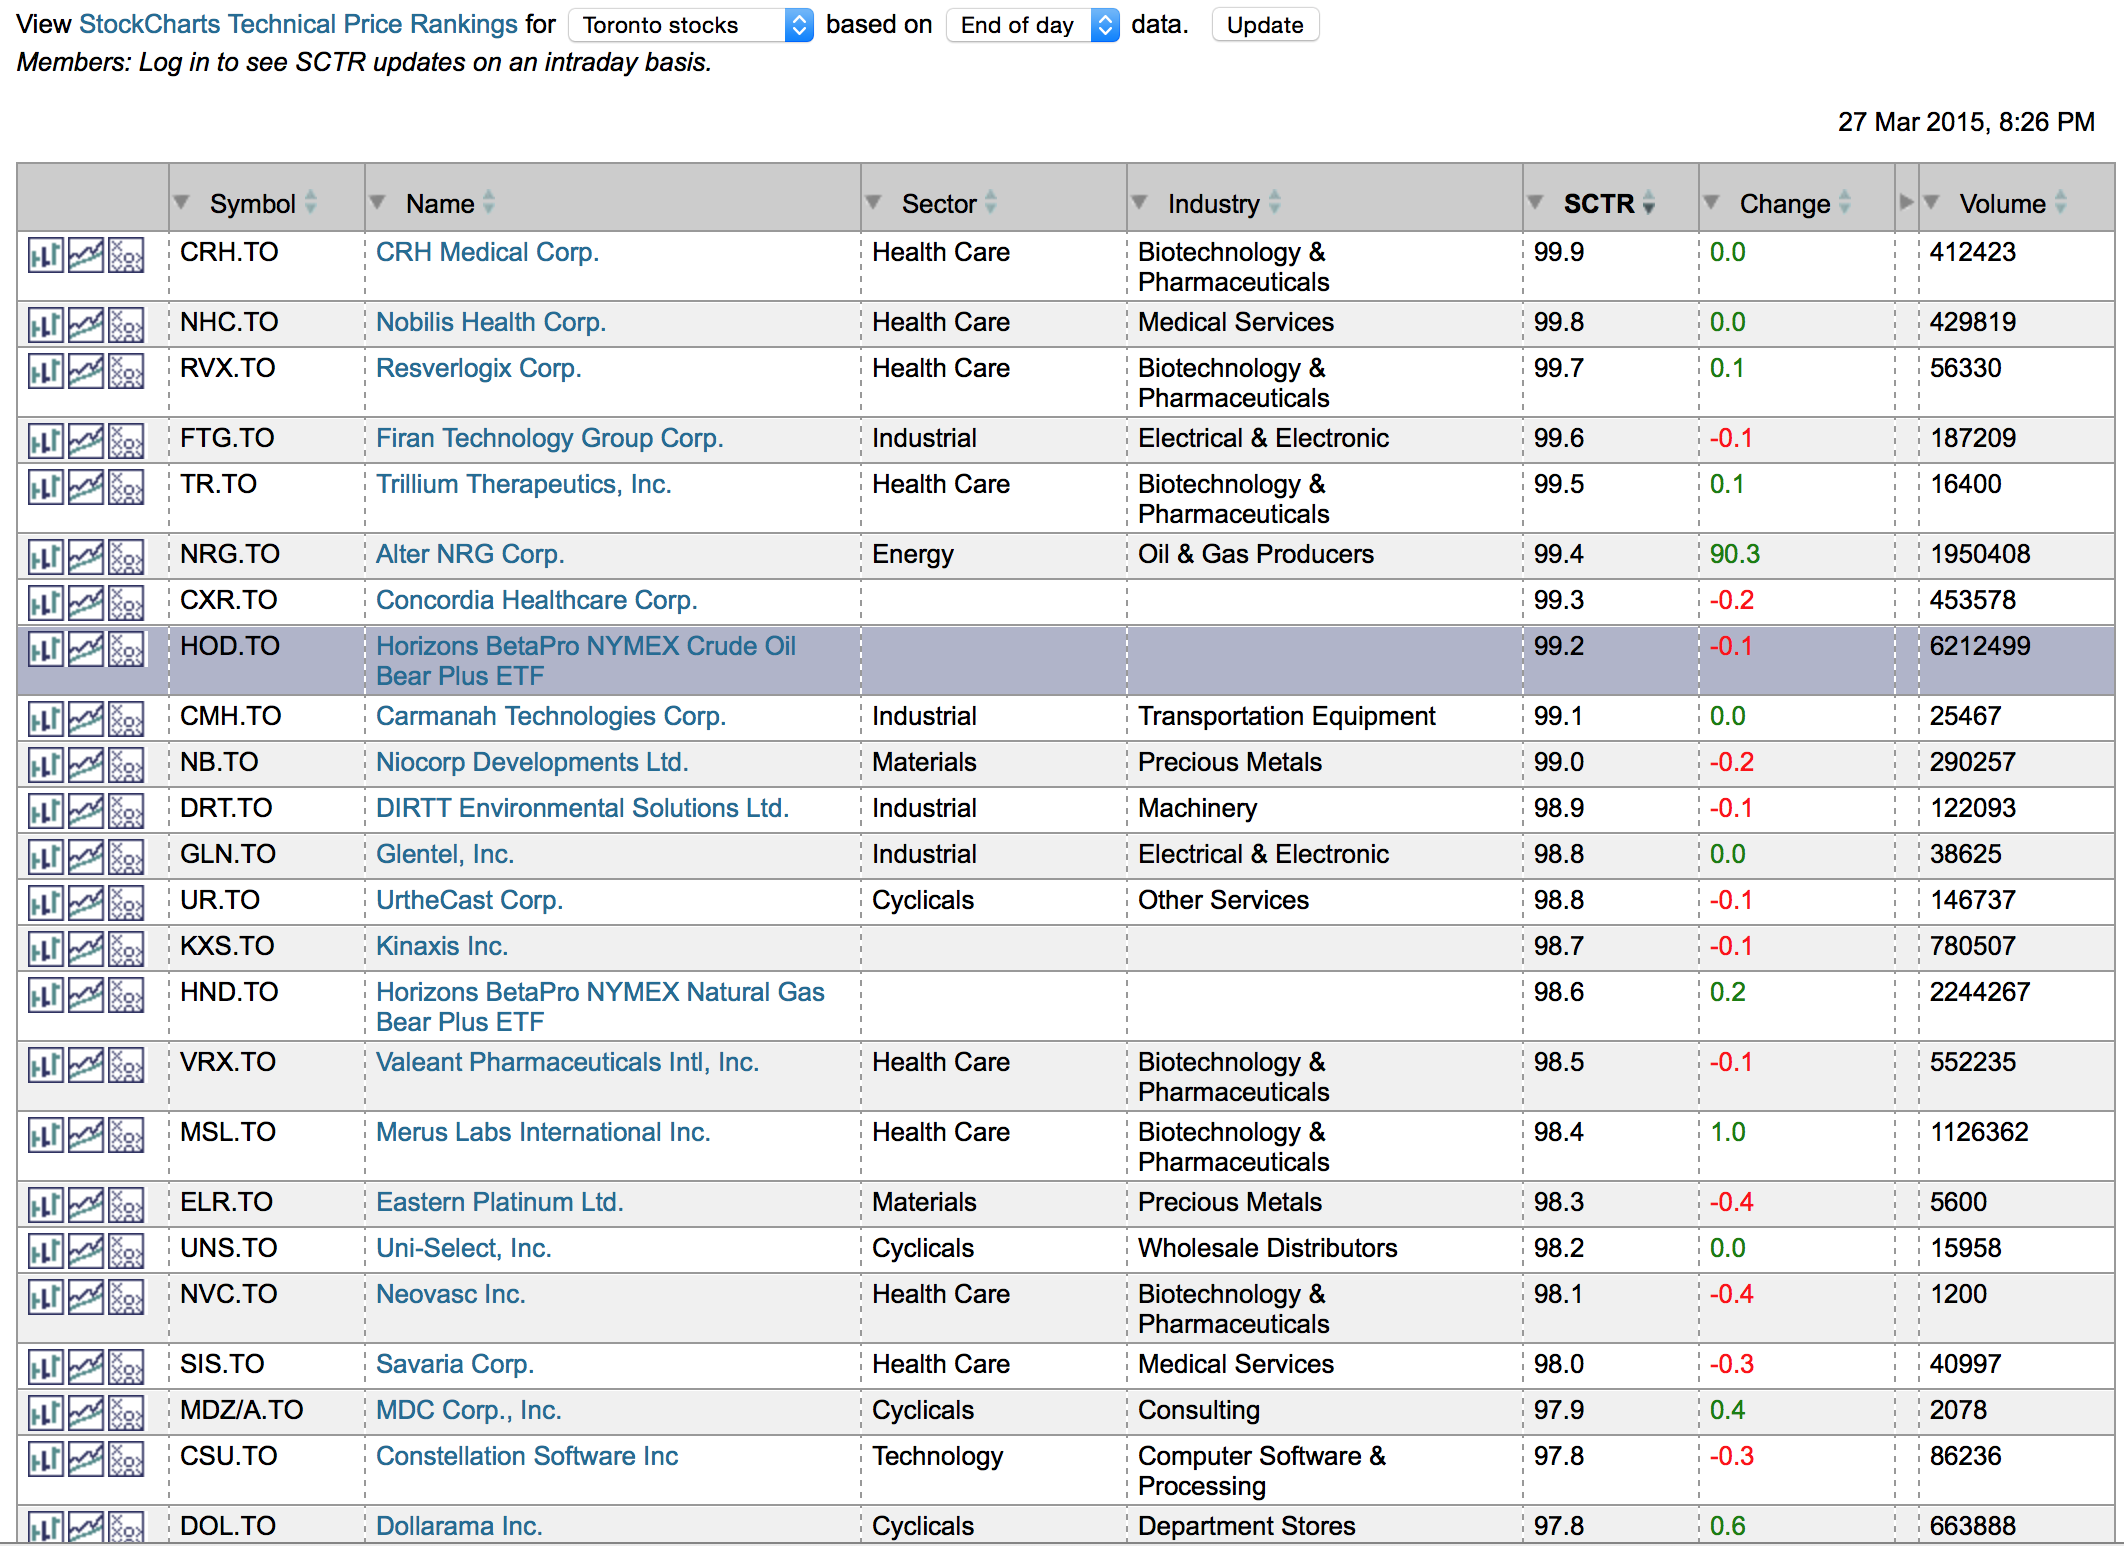
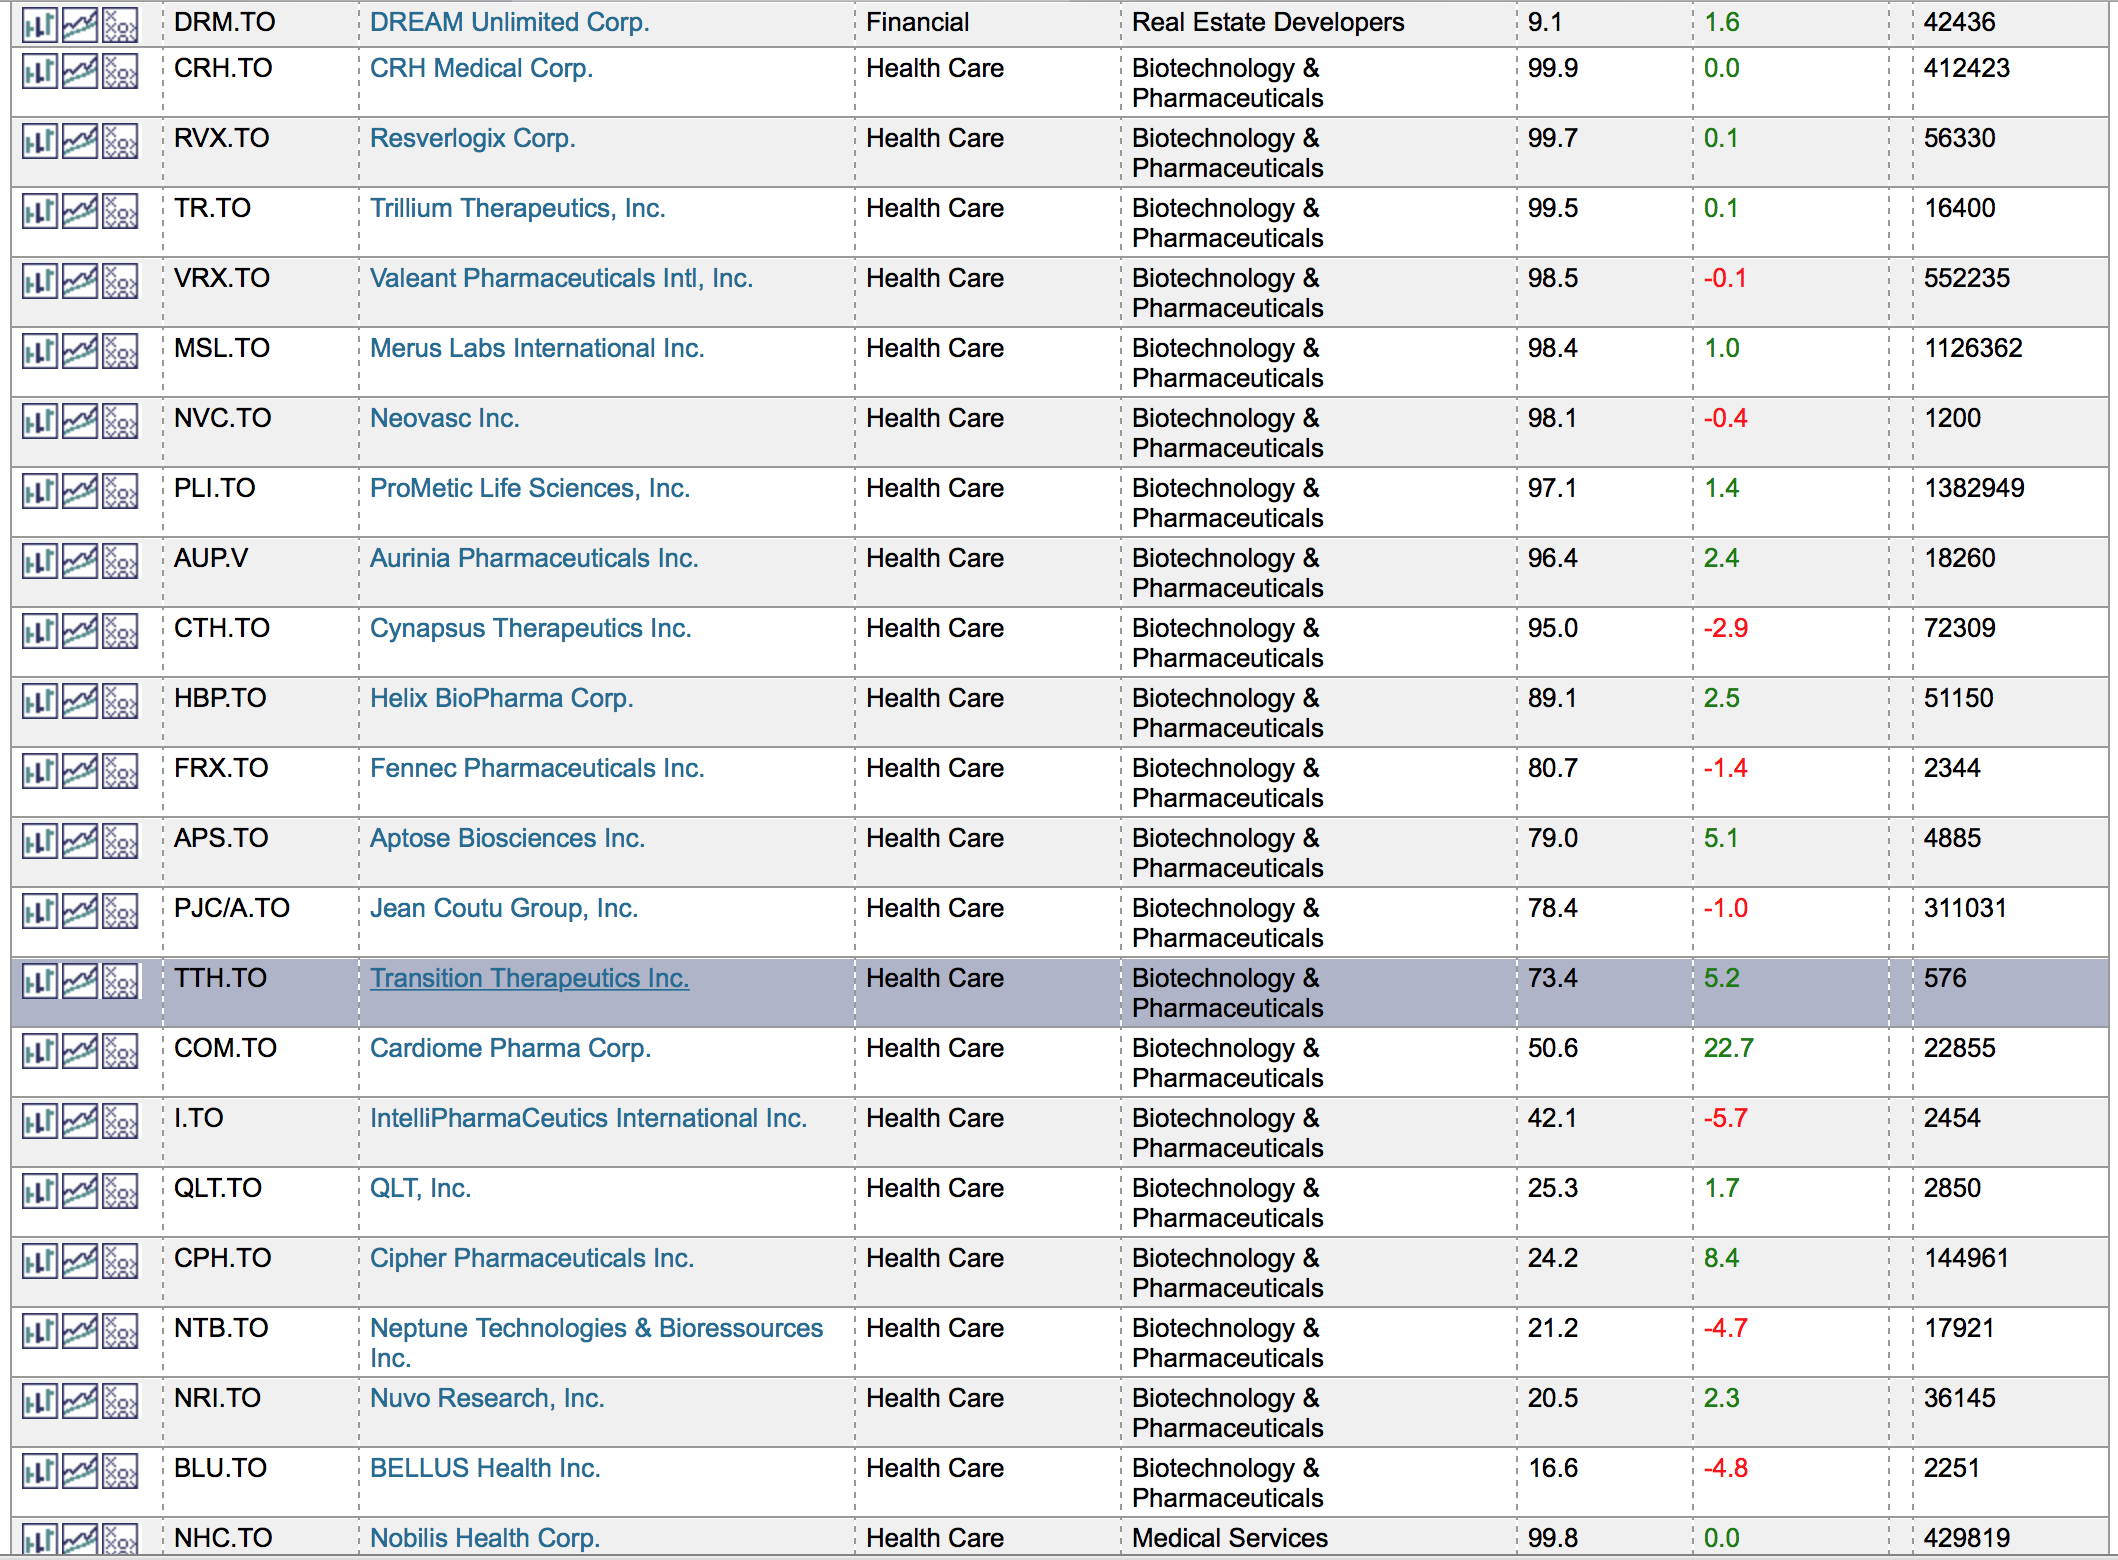
We can now sort this by Industry and Sector. In the example below, you can see that the sort order for the last entry at the top is very small, so it was the bottom of that group. All of the Canadian Biotech are listed and they are ranked by SCTR. At the bottom of the list, is the start of the next industry group. It is Medical Services. Notice how the SCTR dropped to 16.6, then jumps back up to 99.8. Even if you don't know anything about Canadian stocks, the SCTR ranking quickly points you to our best stocks. If you like to buy strength, I prefer stocks above 75. So here you can see the entire Canadian Biotech group. When the majority of stocks in the industry group are above 75, the industry and sector are providing a huge lift. I have highlighted the 75 level with Transition Therapeutics. This makes it very easy. Industry groups where not a lot of stocks are participating are more difficult.
Let's continue to use Canadian stocks as this highlights the value of the SCTR for investors very quickly. Using the SCTR, Industry and Sector sort, you can quickly analyze a group. 2 of the 3 pipeline stocks are weak. Only one of the 'Bank' stocks is above 65 and it is not really a bank. The banking leader offers Currency Exchange at airports. Knowing all of our banks are currently experiencing weak price action, would you want to be there? Finance and leasing have more than 1/2 above 75. Are you interested?
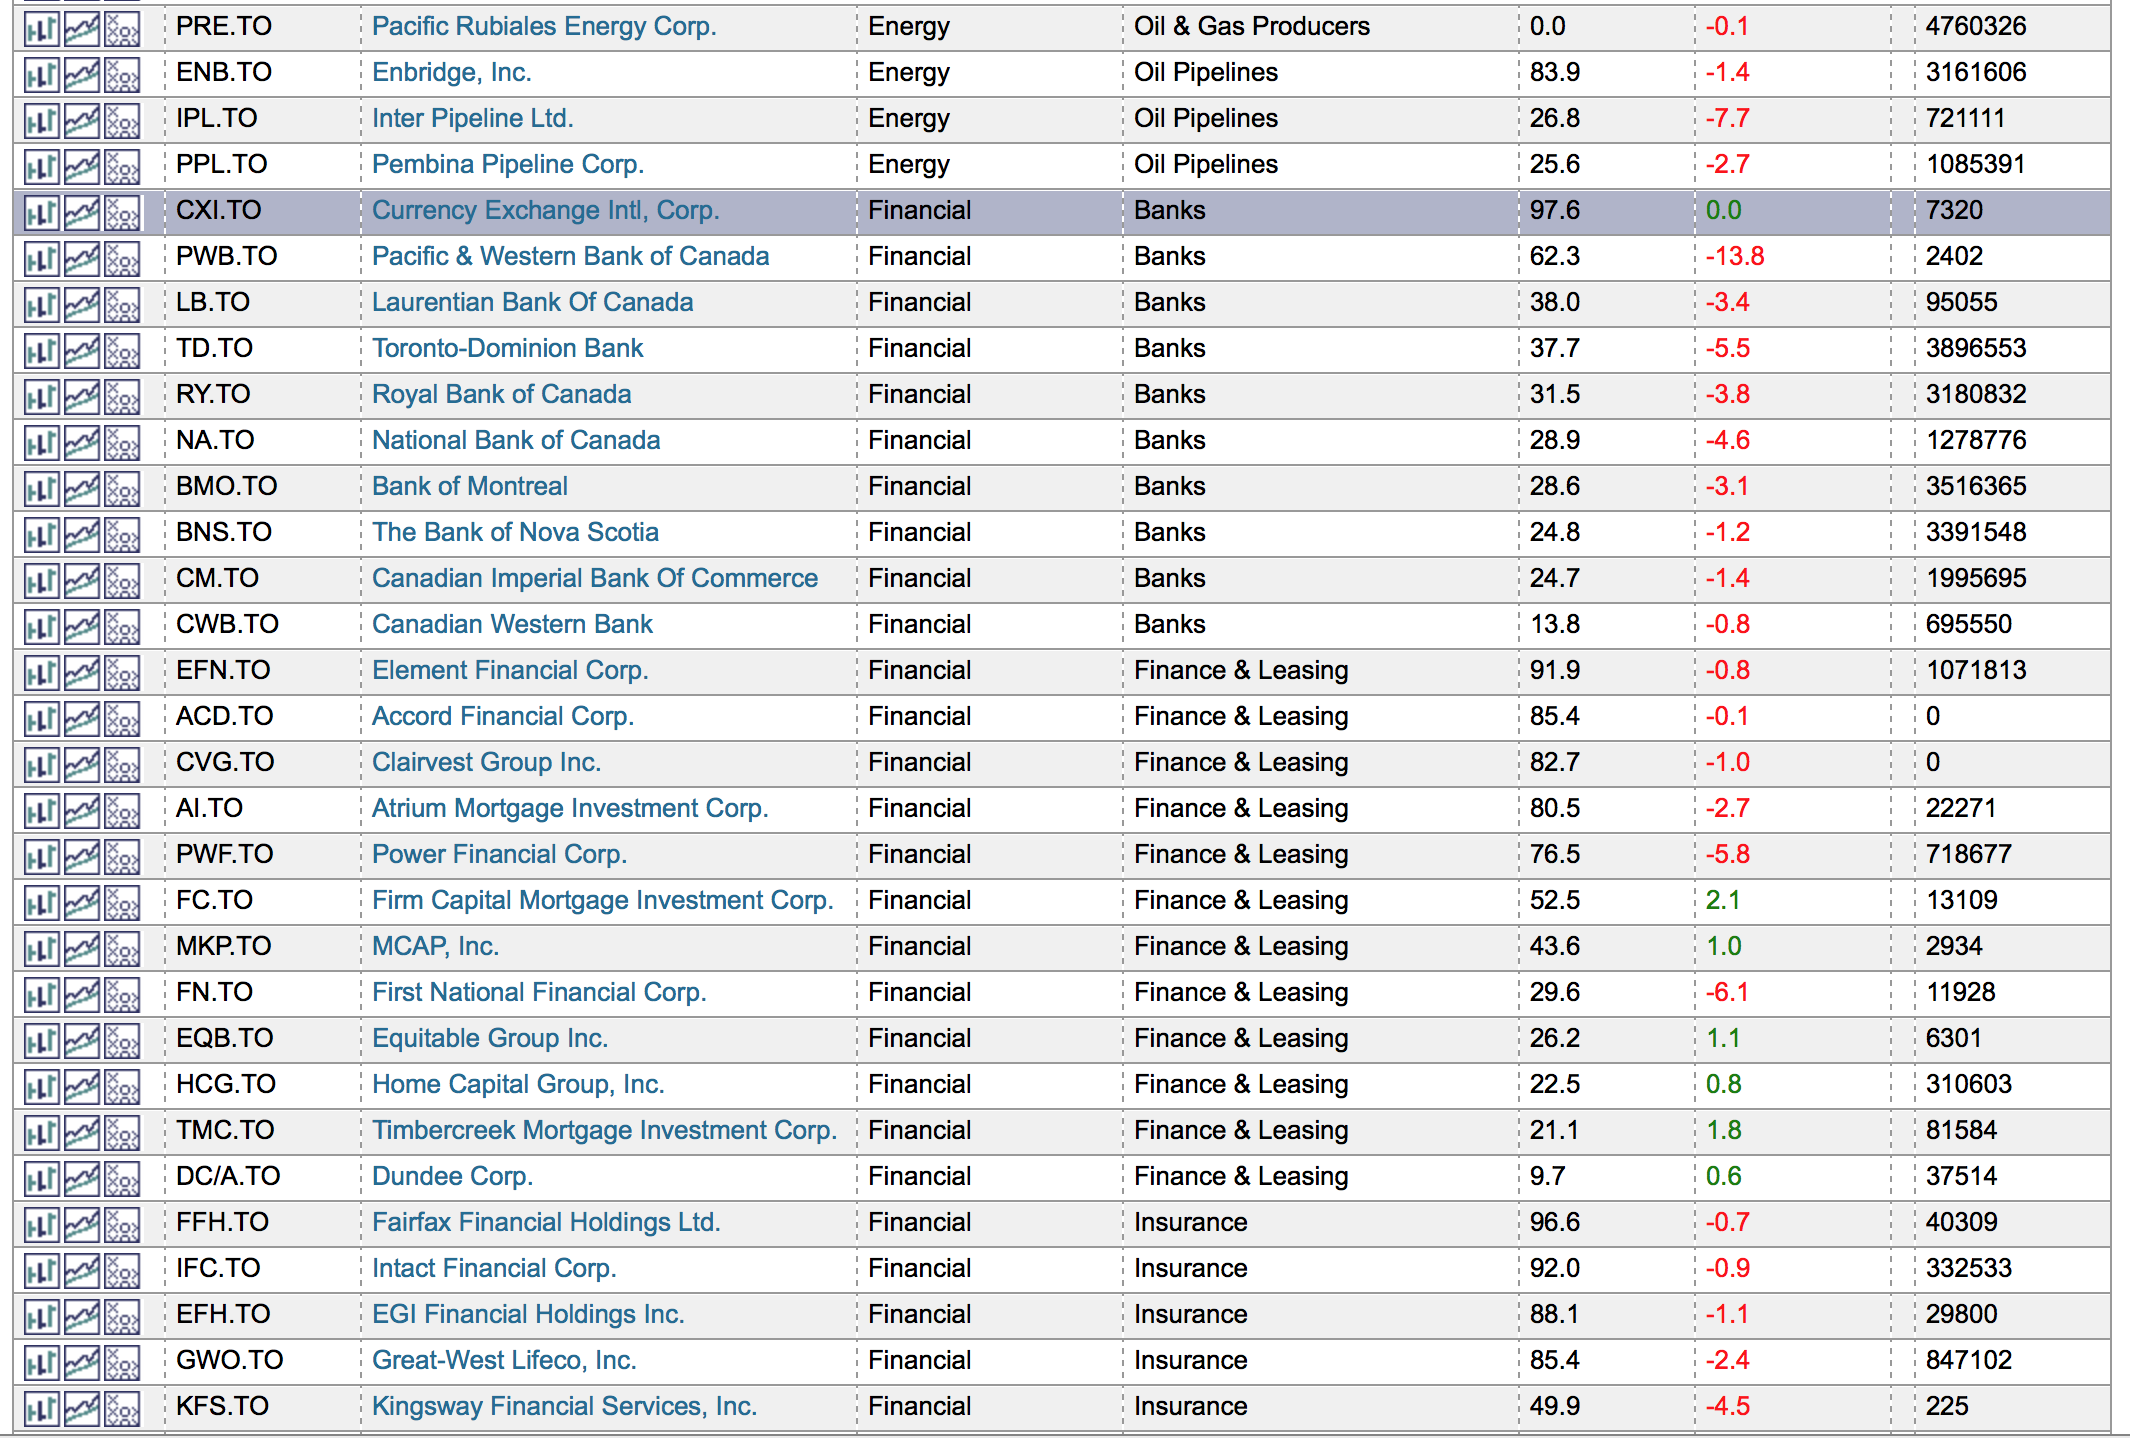
Hopefully I have clearly illustrated what I think is the most valuable quick look indicator on the entire website. You immediately know how price is behaving. The best Canadian bank is at 37.7.
I absolutely love the SCTR ranking system. It is the single best indicator for pointing new investors as well as experienced investors to strong stocks!
It takes time to write this all out, but I think less than a minute leads you to the best in every group!
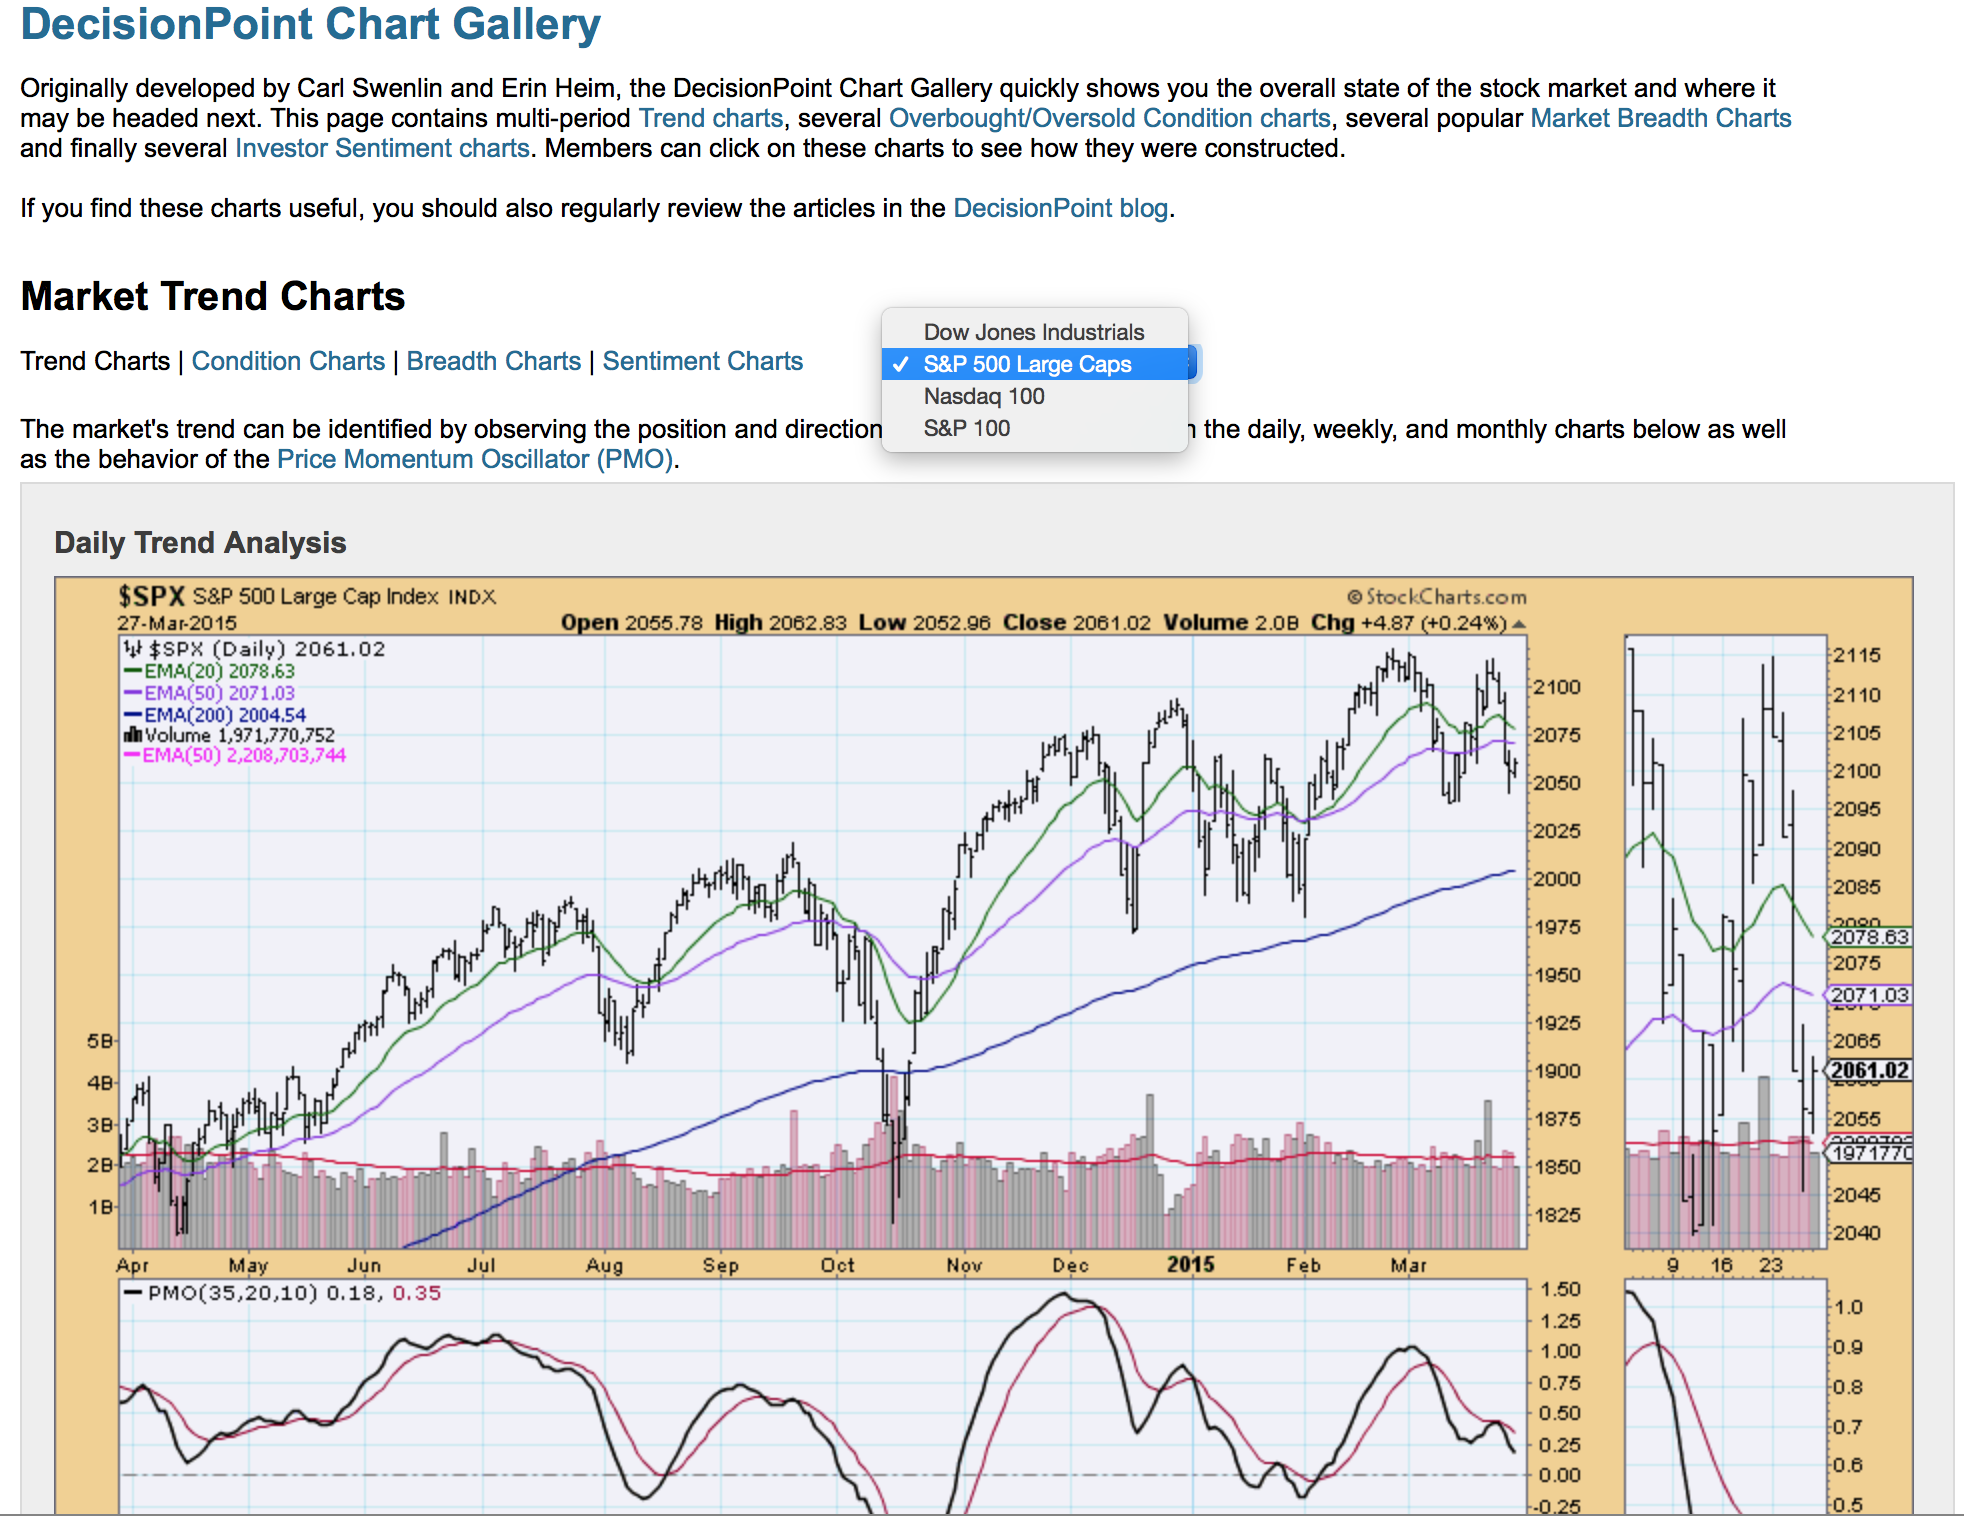
Let's head back to The Golden Line. The next link is the DecisionPoint Chart Gallery. This has only been on StockCharts for a year. These are a fabulous compilation of data compiled by Carl Swenlin and Erin Heim, CMT.

Let's click in on the DP Gallery. First of all, this is US only. But this is the fastest way to get Sentiment, Breadth, and the valuable PMO signals on the indexes rapidly. I don't use this as much as the other tabs daily, but I click in multiple times per week. I am also using both DP reports on the blogs page. All of these are valuable tools. I would encourage you to investigate this as Carl and Erin have an amazingly loyal following.
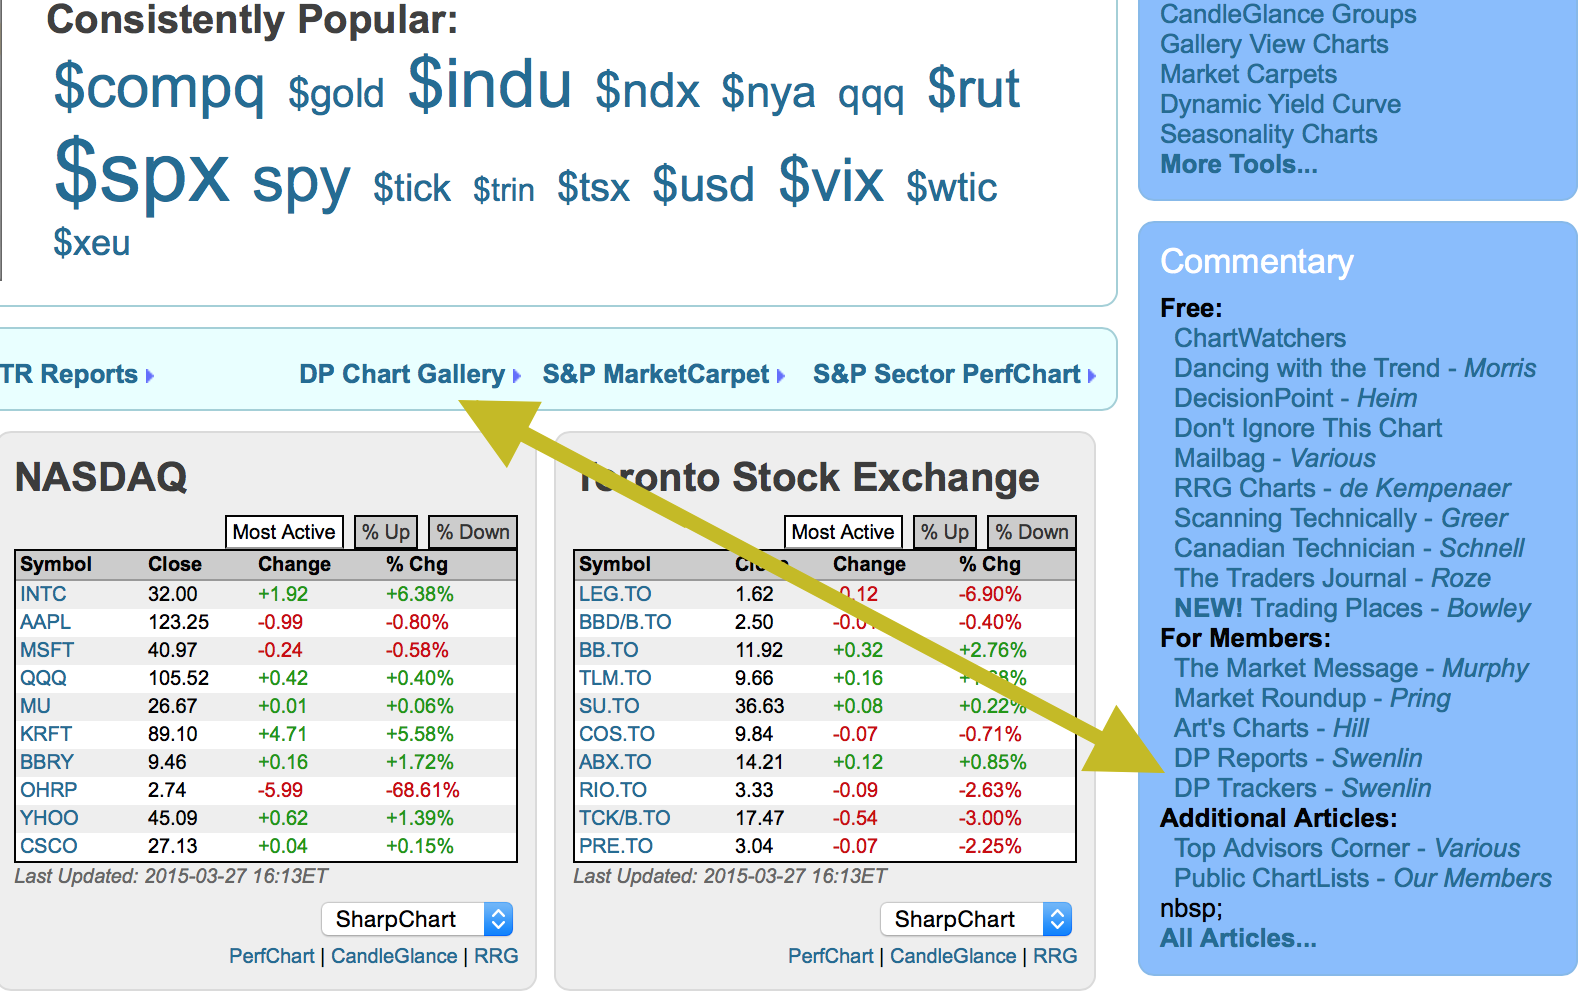
Here is where you can find the links to all of the DecisionPoint work.
I am going to end this article here and come back to cover off the final two tools on The Golden Line. This has turned into a series about the power of The Golden Line. I think you'll agree this is building in to huge value on the home page!
Good trading,
Greg Schnell, CMT
