- The Barrier at 100 for the $USD index
- Gold Rallies on the Stalling Dollar
- The oil low last week has held for one full week!
- Defensive posture is entrenched
- Bank weakness wakes up Wall Street
The Canadian Technician Webinar on Tuesday focused on Gold stocks and Oil stocks. This particular week has a very informative piece on how the SCTR can help find strong stocks within a strong industry group. We were able to compare the gold stocks and oil stocks to each other and demonstrate the differences in market bottom behaviour.
Below are some highlight charts from the webinar.
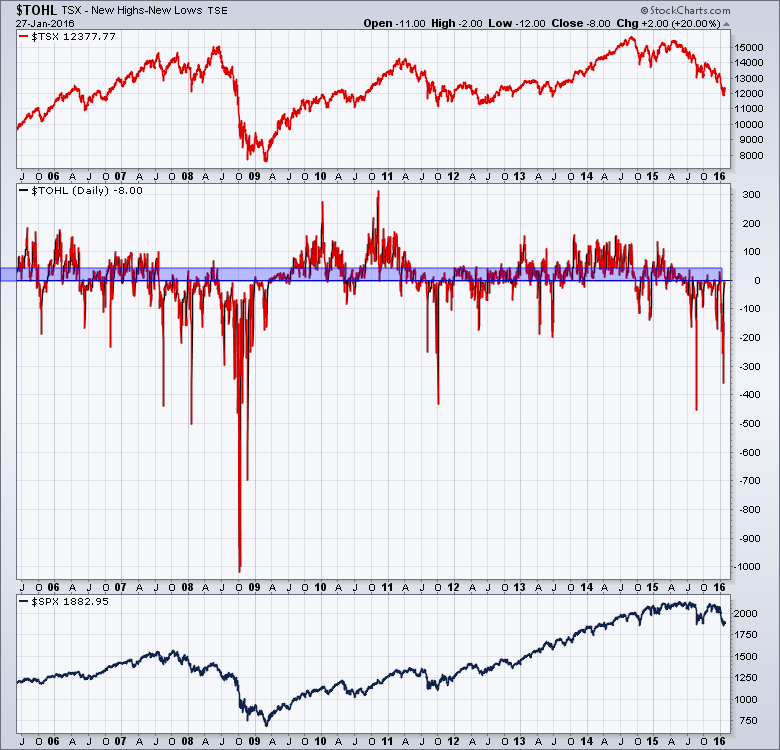
The High-Low chart continues to deliver less than 50 new highs as shown in blue shading. Until that trend breaks, the Canadian market is probably moving lower.
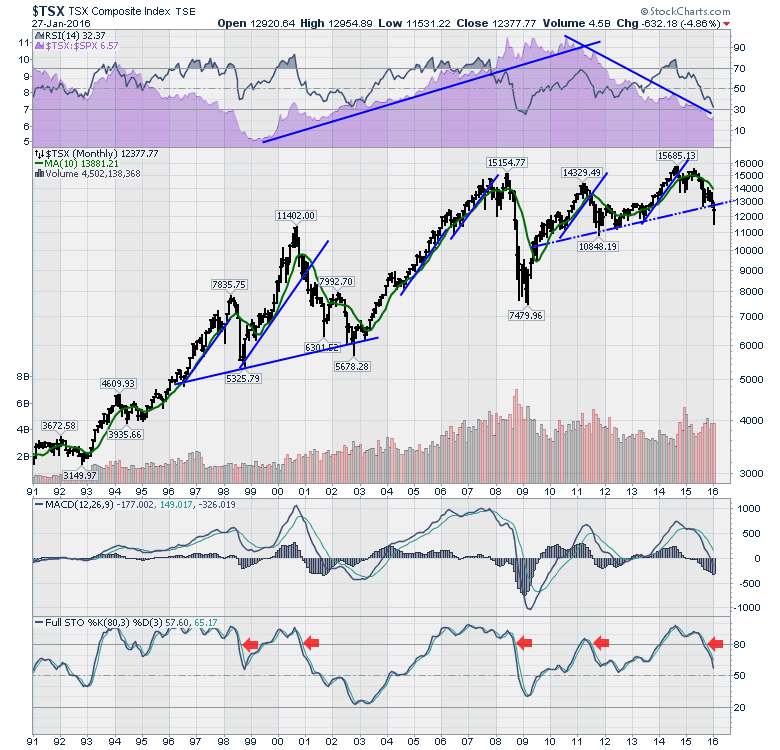
 The $TSX chart monthly shows a major breakdown.
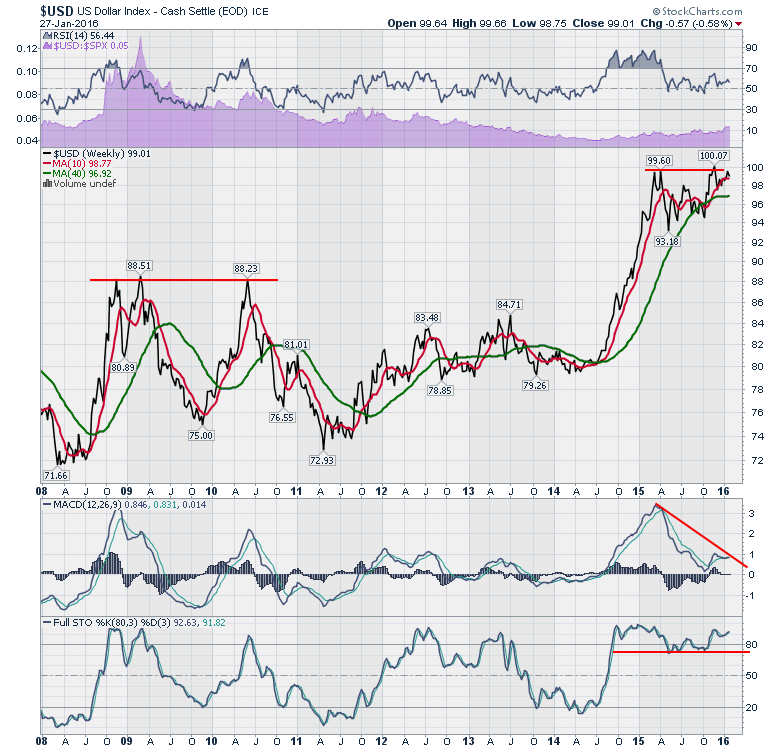
 The $USD keeps hitting a ceiling at 100.
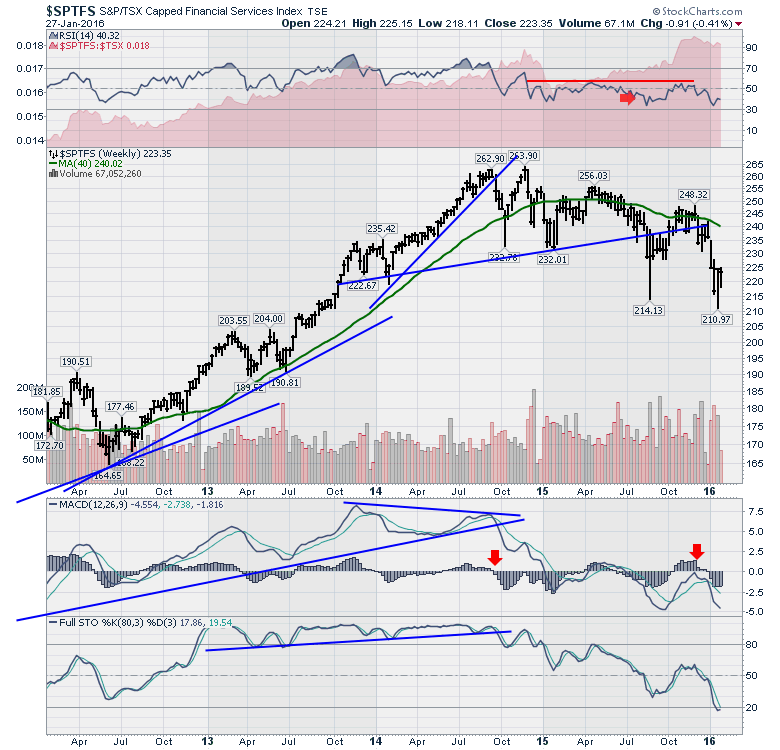
 The Canadian Financial Services Sector broke to new 2 year lows last week.
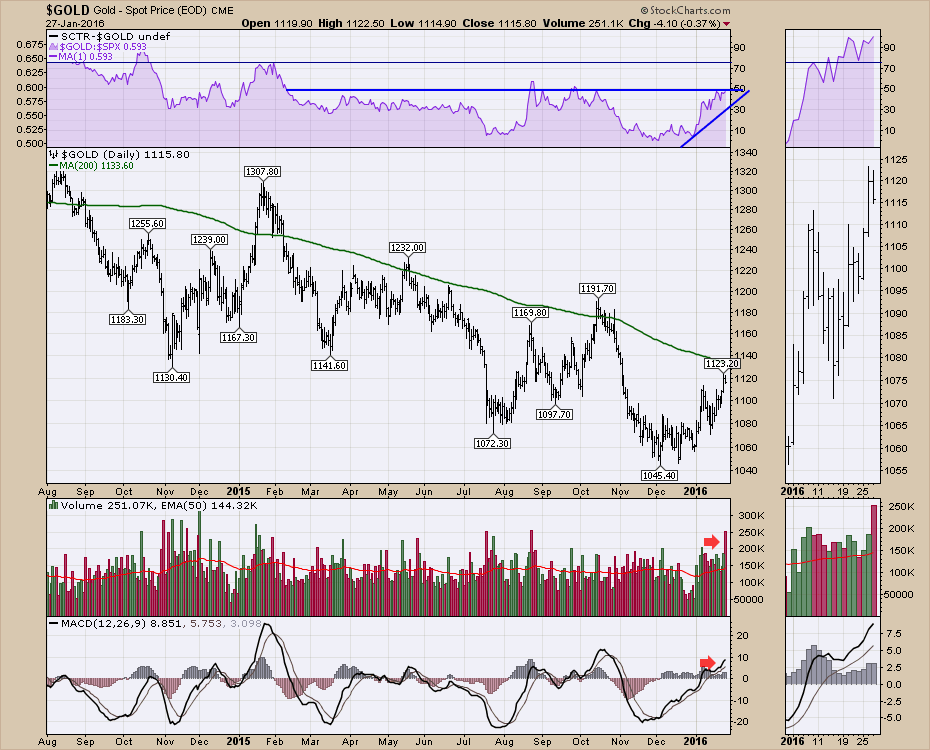
 Here is the chart for $GOLD. If the relative strength shown in purple can break to new 3 month highs, it could also break out to 12-month highs in the next few weeks. Currently, $GOLD is one of the most interesting charts.
I will be doing a Commodities Countdown Webinar on Thursday at 5 PM EST. You can register here. Commodities Countdown 20160128. You may also wish to follow me on Twitter @Schnellinvestor. You can also subscribe to these blogs for email delivery to you. Just click on the Yes box below this article.
Good trading,
Greg Schnell, CMT

