Markets worldwide are testing important levels. Today was a very important step back. It really marks an important place on global charts. The markets could also move meaningfully higher from here as well, but the SCTR rankings currently do not show any change in trending sectors so it would appear to me that the bears are in control.
Let me show two charts. The $TSX has already broken below support, whereas the $SPX continues to oscillate around support.
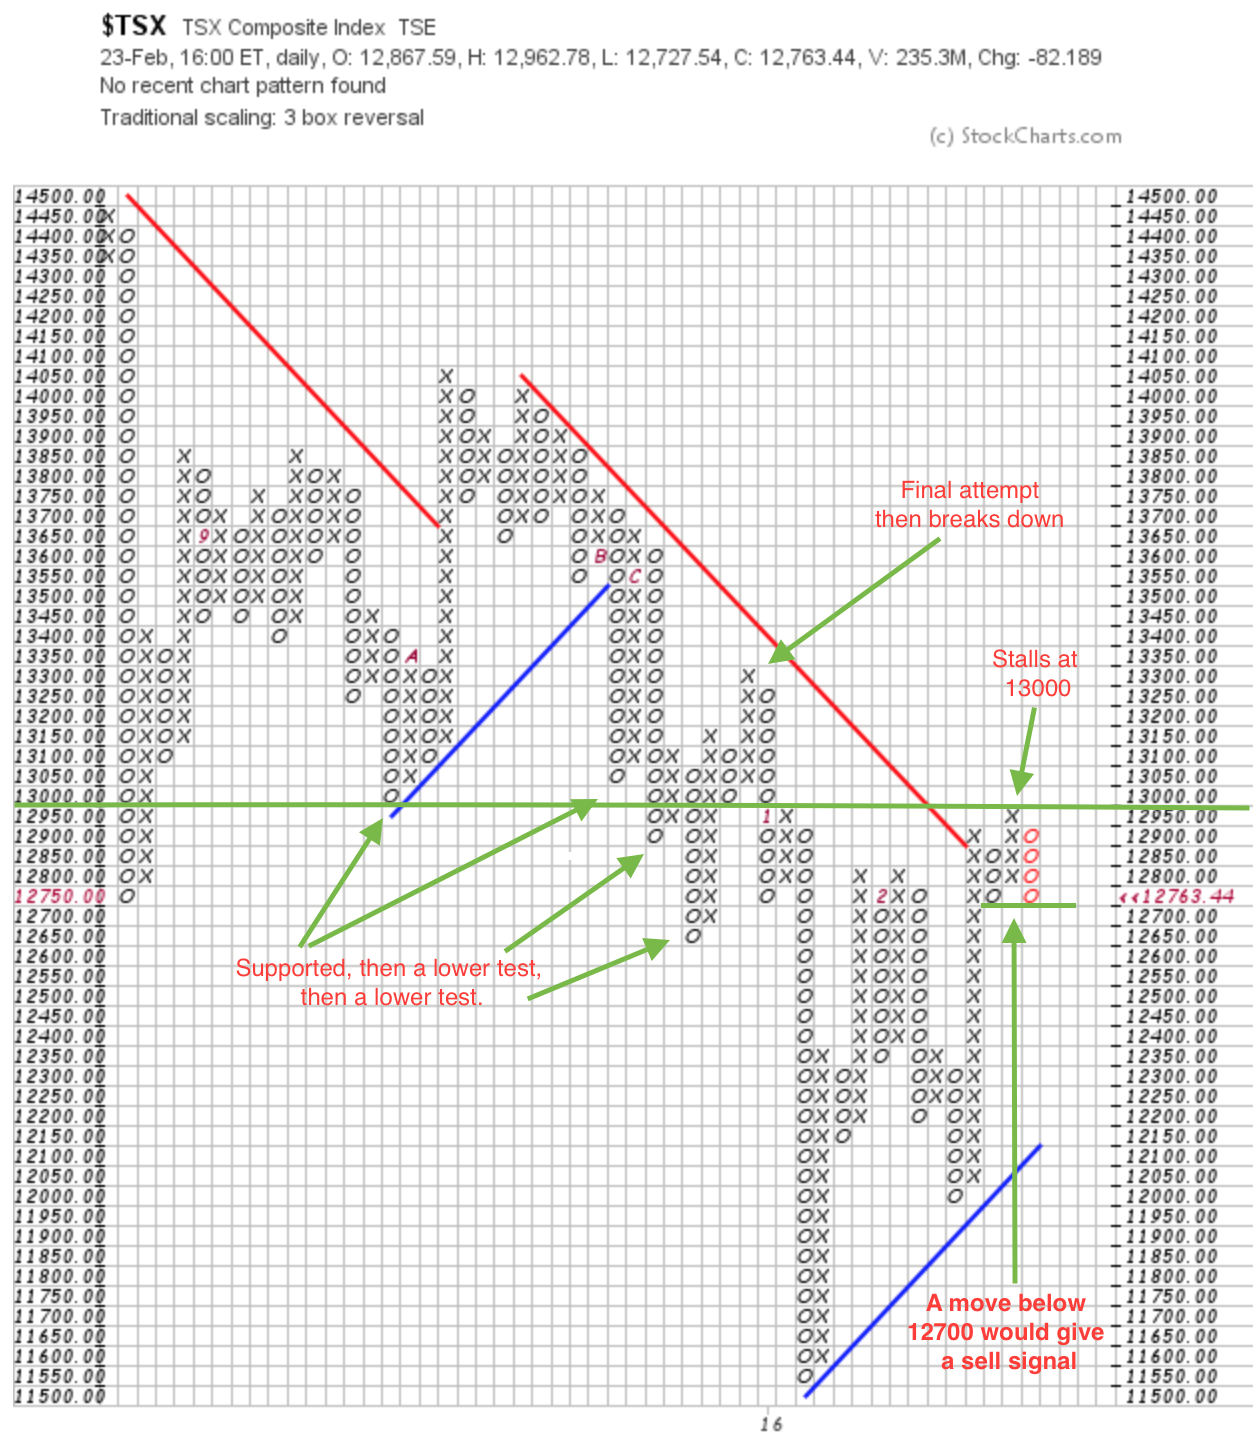
I'll work through what I mean. Starting with the $TSX, I published a PnF chart showing how important the 13000 level is last week. Now we snuggled up to it and reversed.
Starting on the left side, we were supported at 13000, then lost support but rallied above, then a lower low and another rally above. It bounced off 13000 right in the middle as it goes back up to make what I labeled as a final attempt. When that failed, it really broke down hard. After the major breakdown, we had two rallies stall 150 points away, one rally stalled 50 points away, and the most recent rally stalled just below it. If we break down through 12700, this could retest the lows quickly.
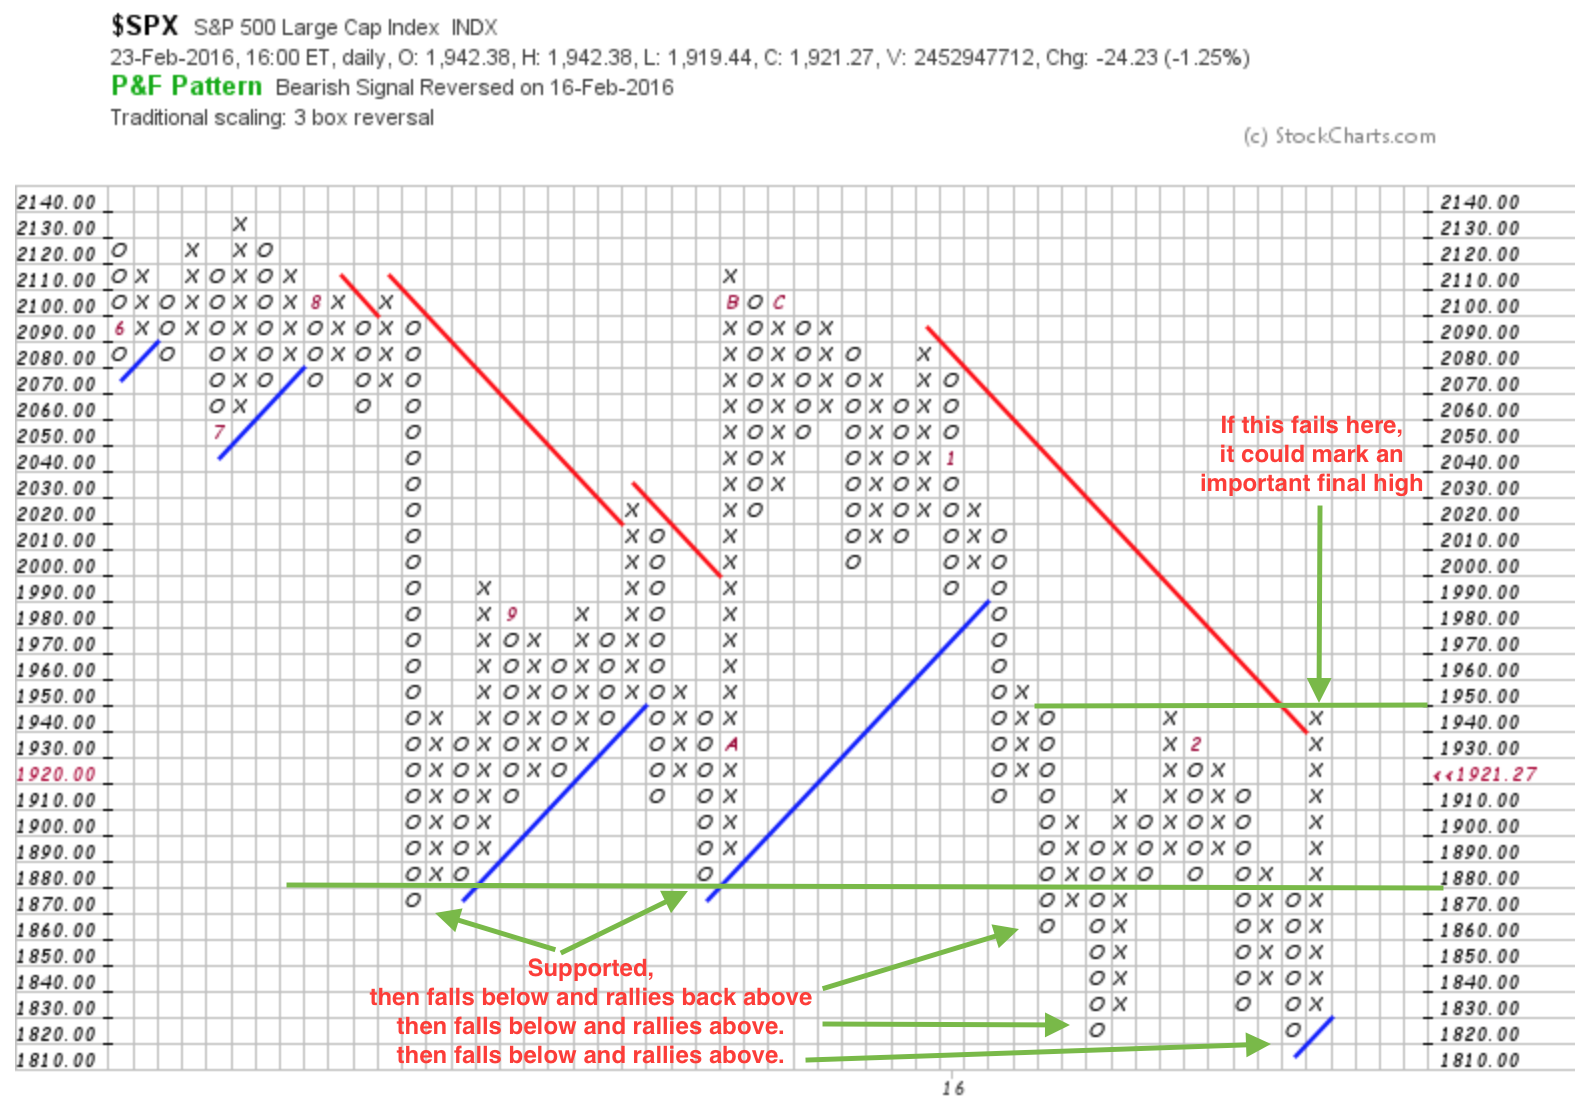
Let's look at the $SPX the same way. It continues to try and get support at 1880, now it has made a lower support level at 1820. If it can't get through 1950 soon, this could quickly move to retest the lows. I would suggest that if it does not have the power to go higher, like the $TSX above, it could break to meaningful new lows. All of these lower lows without the ability to make higher highs is very important. I will say it is currently on a buy signal and has not started to make a new column of o's, but a move below 1910 would start a new column of o's.
Let's just say it's very finely balanced. Based on our SCTR rankings, there are no new sectors moving to the top. With the defensive sectors leading, and no real bullish risk-on sectors emerging, I am leaning to the downside.
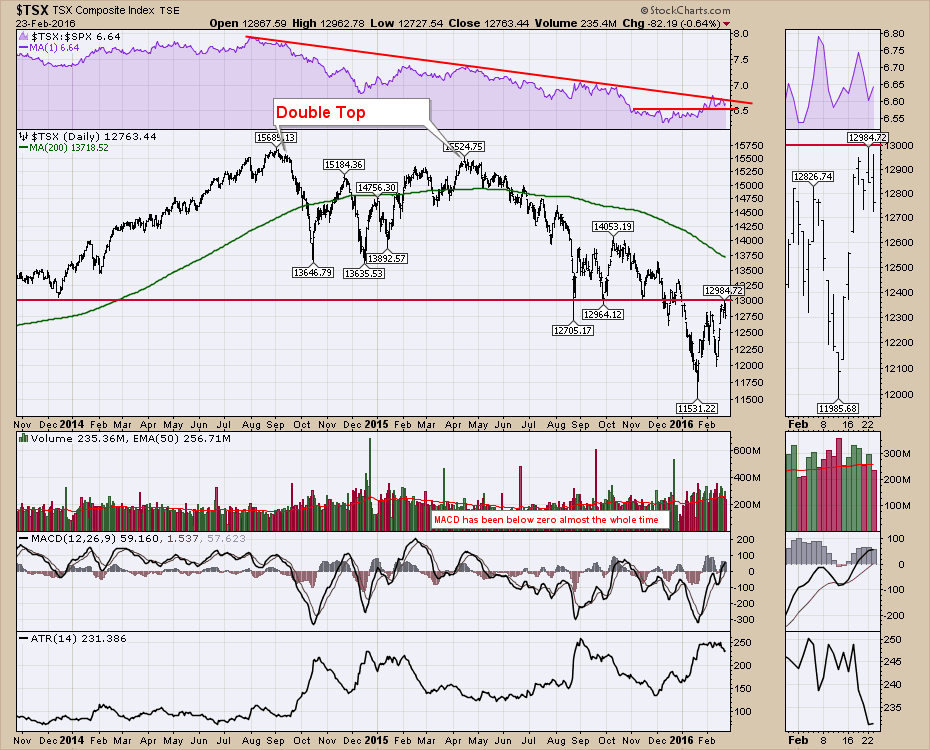
For those familiar with the regular Open, High, Low, Close charts, let me show the two charts again.
Here is the $TSX with a line at 13000.
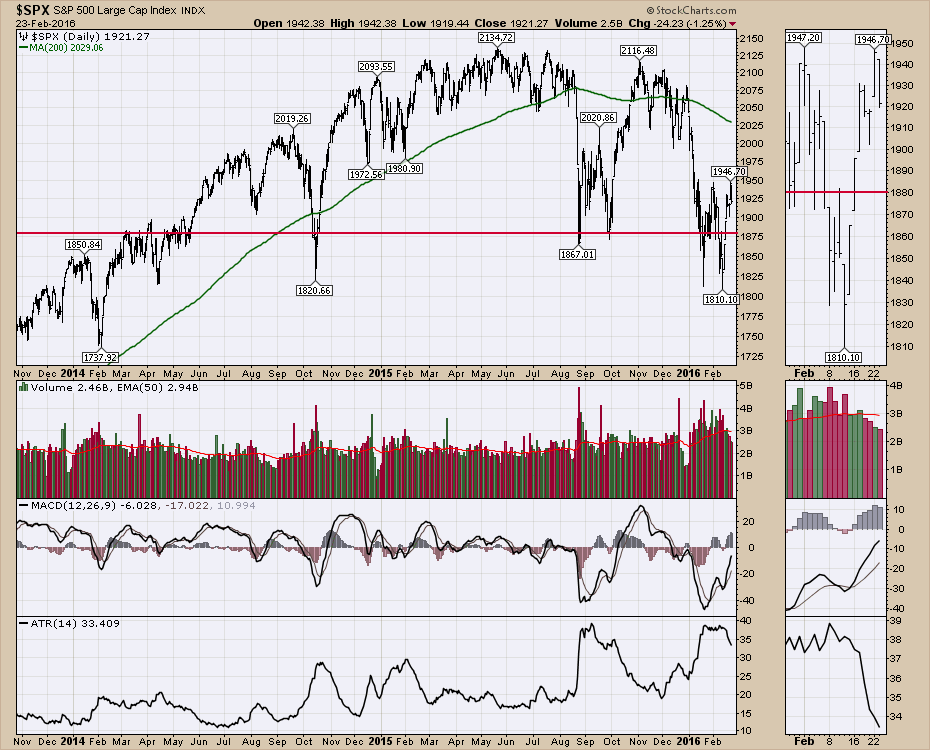
 Here is the same view of the $SPX. The current rally is important. A meaningful break, either way, will cause a lot of positions to cover.
 I covered this off extensively on the Canadian Technician Webinar. 20160223.
Many people are wondering when it will be a great time to buy the oil stocks. Currently, it's been a great time to 'trade' the oil stocks. There are almost no oil stocks starting to outperform. This recent rally in gold had massive support from a wide range of gold stocks. Oil has yet to make a higher high and bounce on a higher low. So this is in a downtrend and confirmed by the oil stocks. We'll get a good look at these when they are ready, but that is not here yet. If you are wondering how to use technical analysis to figure out when to enter the oil stocks, I covered a lot of examples on the webinar. The Canadian Technician Webinar 20160223.
I did mention that pipeline stocks were starting to percolate. How would you look to get in on those? I covered off how to set up a chartlist with the USA and Canadian pipeline stocks in less than a minute and look at them in Candleglance view. Based on the survey results after the webinar, this was one of the highlights. I am not a big fan of many lines of code working to a tight limiting list. I like to get a list that I can scroll through and see the complete industry group. For 'very' simple starting scans, this can help you.
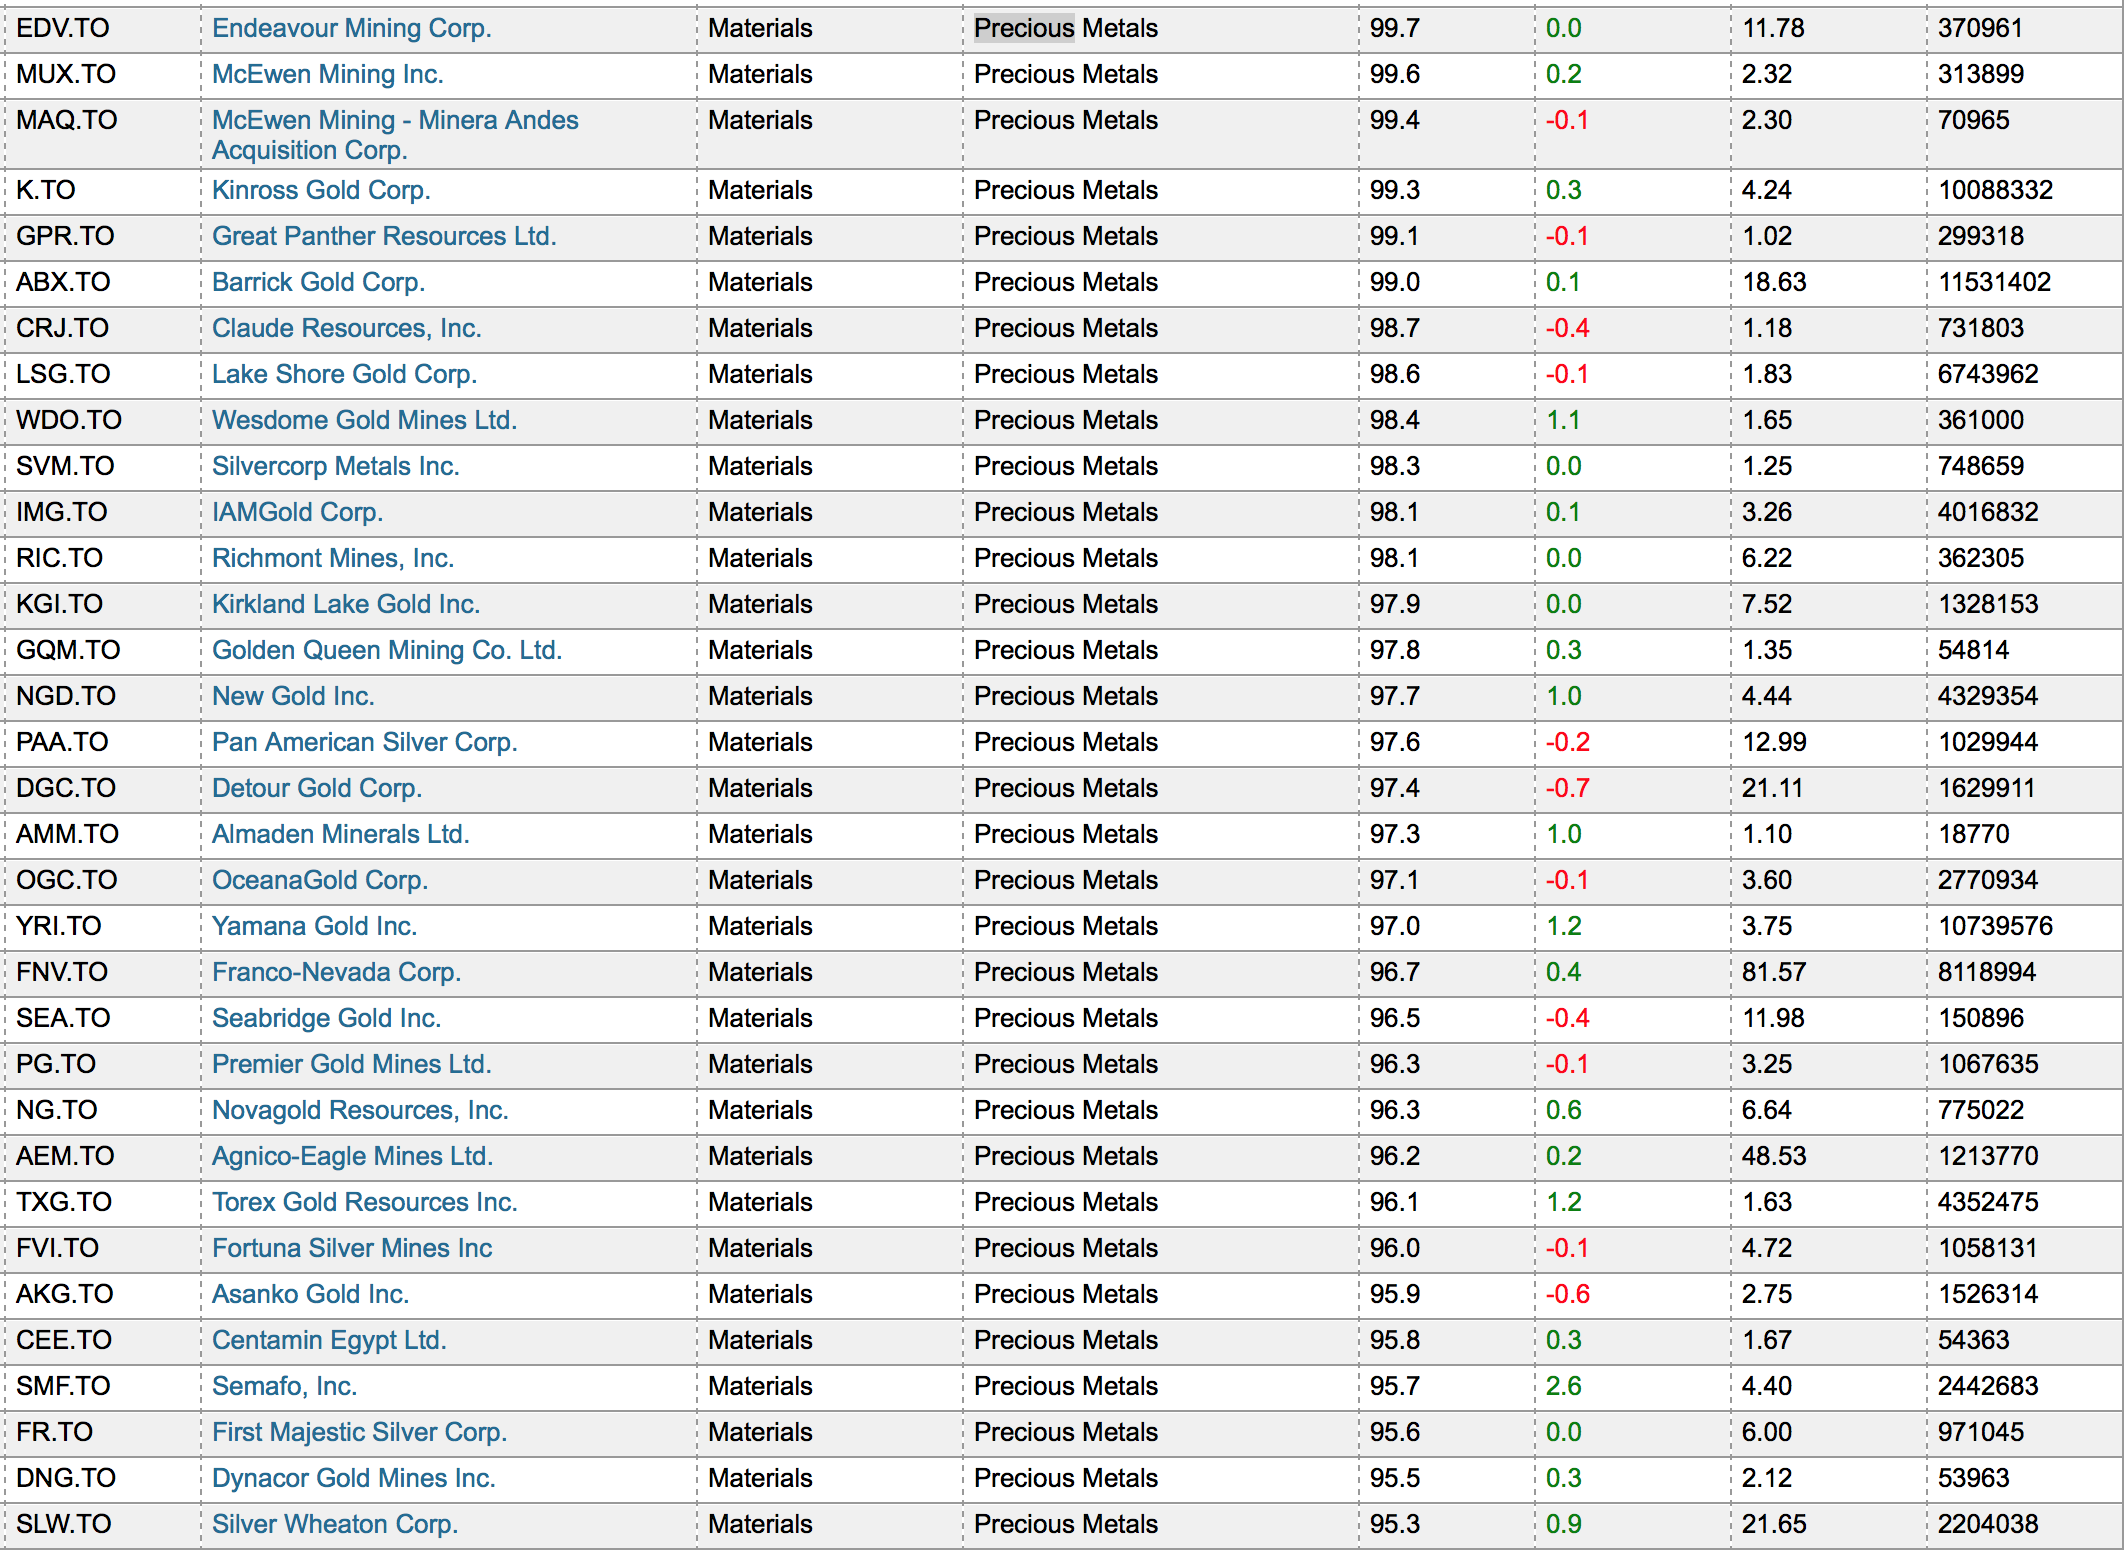
The most popular question posted was about the gold rally. I noticed one of my fellow peers in Technical Analysis was already selling this rally. While he may ultimately be right, based on my work, I have no sell signals on gold yet. This is a screen shot of the precious metals industry group for Canada. There is so much breadth in this move, and so many stocks are behaving better than any of the other industry groups, and many of the stocks are breaking out to new 52 week highs. I would expect the group to start slipping with the weak performers starting to slide as the move comes to an end.
 Staying in a rally is the hardest thing to do. Human instincts are always quick to take profits and slow to sell losers. Good traders spend years trying to develop the skill to stay in the trade. Currently, I have no sell signals. On the webinar, I highlighted why it's important for me to stay in this trend and what technical conditions would show up for the exit.
To watch the webinar, click here. The Canadian Technician 20160223.
Lastly, I recently posted (Monday) about the Material stocks starting to make higher highs. Today this looks like a failed breakout. If it can not hold above the breakout level, this is a failed breakout and positions should be exited. There is lots more on the webinar, which I think you'll find a compelling hour at this hinge point in the market.
Good trading,
Greg Schnell, CMT, MFTA.


