Since the Federal Reserve minutes last week, some investors are modifying their expectations for at least a 0.25% increase. Looking on the StockCharts.com homepage today, it was also clear that some of the Canadian insurance companies were starting to show up on the most active list in early trading.
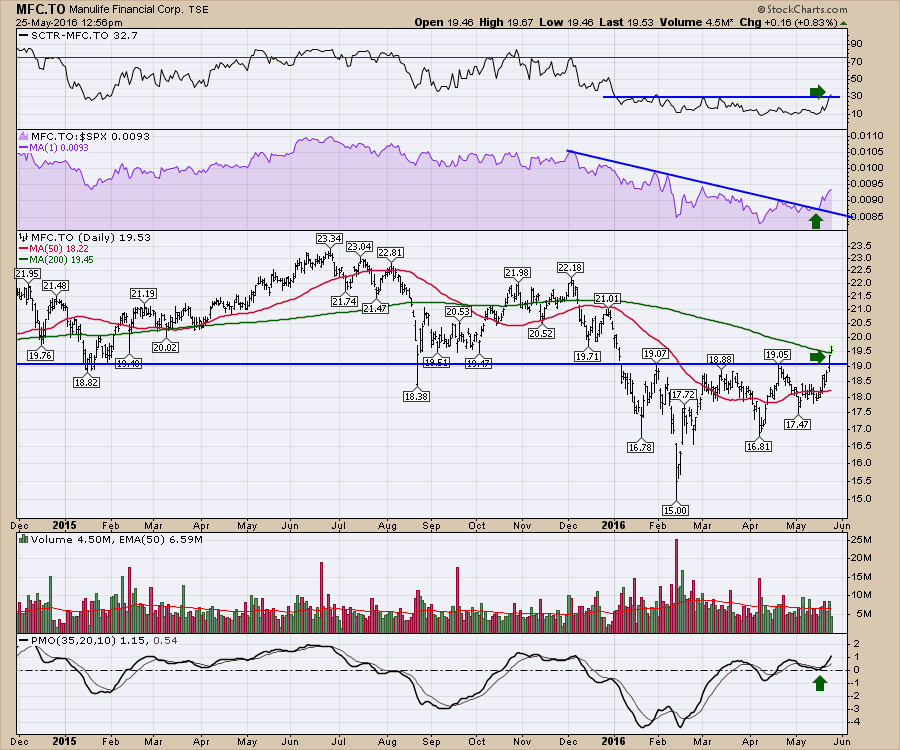
A good example is the Manulife (MFC.TO) chart. The SCTR is hitting a 5-month high. This is still weak, but accompanied by a pattern breakout, this probably has more room to run. The SPURS ( This is my acronym for the S&P 500 Relative Strength comparison shown in purple on my charts) is breaking out of the 6-month downtrend. This breakout started on the release of the Fed minutes. $19.00 was a support level on the price plot for most of 2015. Since the start of the year 2016, it has been trapped below. Now that resistance level of $19.00 has been broken, we can use it for support to trade with a stop just below there. The price is also breaking above the 200 DMA today for the first time since early December. The volume was above average breaking through resistance which is what we want to see. In the final panel, the StockCharts PMO is breaking to 2016 highs after making a cross above the signal line while above zero. That's very bullish. All in all, a great chart.
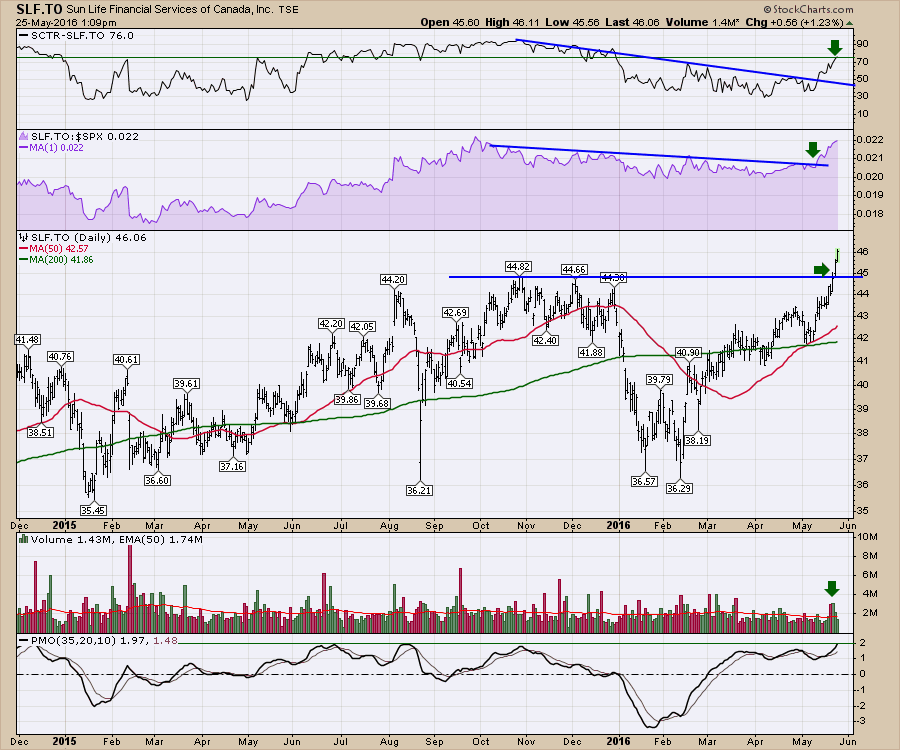
A similar story to MFC.TO is Sunlife Financial (SLF.TO).
Look at the strength in this chart after the recent Fed discussion. The PMO is making 18-month highs! Everything looks great including new 52-week highs. But if you expand the chart, it is new all-time highs. There is an old saying: "When you are making new highs, you are not in a bear market." My favorite indicator, the SCTR, just jumped above 75. That puts it firmly on my trading radar.
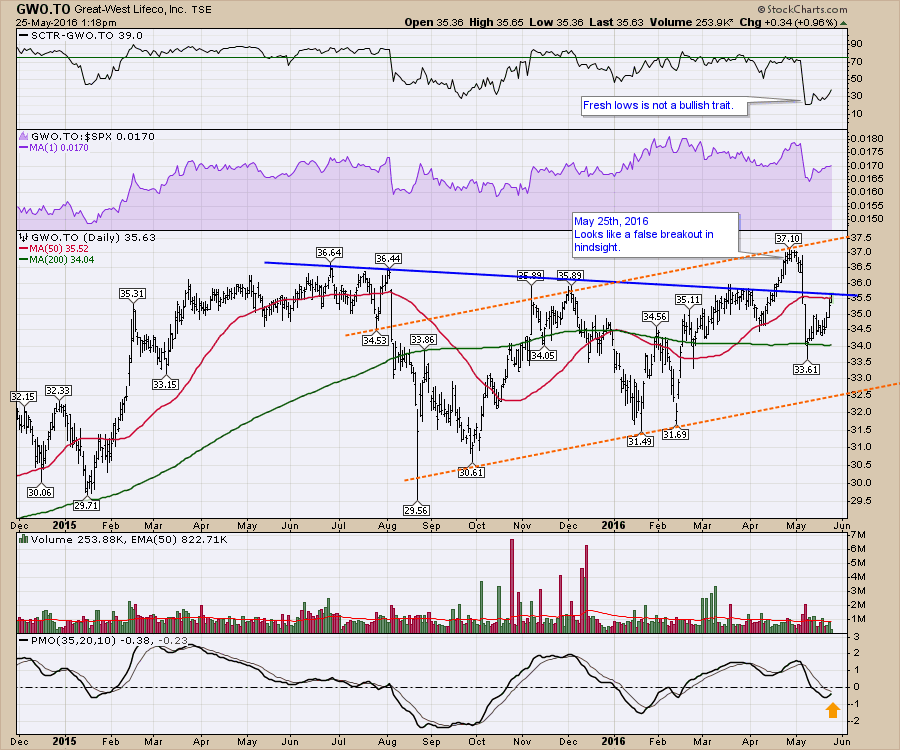
 Great-West Lifeco (GWO.TO) does not look as good at first glance but a little more thought on the chart is helpful. The first thing that caught my eye was the lower highs, the false breakout and new lows in the SCTR. After the SCTR made new lows going back at least 18 months, it turned back up on the Fed minutes. The price plot shows a breakout above the blue line in April that failed to hold. We are currently testing this trendline. A break back through would be very bullish and argue for higher highs. There is a trend of higher lows, which I have highlighted with the orange dotted line channel.
This is a good time to investigate the stocks in the financial sector. I'll make sure I do an in-depth review on Tuesday's Canadian Technician webinar. You can register by following this link. The Canadian Technician 2016-05-31. Also, if you would like to subscribe to the blogs, click the Yes button immediately below and they will show up in your email inbox. It's usually 1-2 per week.
Recently, I posted some articles discussing the gold industry and during the last couple of Commodity Countdown Webinars (2016-05-19 and 2016-05-12), we have been more cautious on the group. Here is a recent article about the Gold Miners on the Commodities Countdown blog. The Gold Miner's Ratio Breaks. You can also click on the bottom of that blog chain to get those emails as well. If you would like to hear more about the precious metals and oil related trades, I focus more time on those during the Commodities Countdown Webinars and there is usually one on Thursdays at 5 EDT. Click here to register for The Commodities Countdown Webinar 2016-05-26. This week, there seems to be a lot of heat lining up in the commodities. I look forward to having you join me live or catch the archives by following this link. StockCharts.com Webinar Archives.
Lastly, Chip announced more details about Chartcon 2016 on the recent ChartWatchers newsletter. There is a window of opportunity to have 10 people - just 10 people - join all the StockCharts technicians in California. I mentioned I would like to play some golf. So there are a few golf spots (3) available to swing the sticks with me and socialize on the golf course. I'd thoroughly enjoy that. Can you make it to California? Here are the details. See Chips Point #4.
Good trading,
Greg Schnell, CMT, MFTA.


