The overbought pullback has arrived. The breadth of the market heading into the overbought situation appears to be demonstrating a new bull market in my work. However, the macro situation is a big cause for worry. We covered a lot on the webinar yesterday.
"The Canadian Technician LIVE!" with Greg Schnell - 2016-05-03 17:00 from StockCharts.com on Vimeo.
Webinar Content // Breadth 0:00 //Crude Oil 4:00 // Currencies 5:30 // $TSX 11:00 // Sectors 21:00 // BPI Charts 44:30 // Commodity Countries 48:00 // Closing Thoughts and Ideas 51:00 //
I am not sure that the fundamental investors are aware of how fine the knife edge is on the charts at this particular moment.
This is the Canadian Financial Services chart. $SPTFS. There are enough technical signals here to send technicians to a bunker. The RSI continues to be in bear mode with a reading below 60. In bear markets, the weekly charts usually stall around 60 on the RSI. Moving to the Relative Strength, the Canadian banks have been losing their strength compared to the $TSX index. While I don't usually compare to the $TSX, this is definitely a concern as the major banks all tried to make new highs recently. The price chart couldn't be more unnerving. After a big topping structure built over the last two years, we recently broke down in the area circled. The rally back up appears to have stalled at the confluence of three trend lines. First is a failure of the short term horizontal trend. The price action recently took out the previous high, only to roll over and fail quite dramatically this week. It also broke below the current uptrend line off the February lows. While that might be considered too steep anyway, there is more to the story. Bear market uptrends are usually quick, vicious and quite upright. They break just as quickly. The third up-sloping line is the neckline for the topping structure. When that line is extended as shown, this looks like a normal backtest of the trendline from below. The final bullet in the gun is the major long-term uptrend going back 6 years was broken in 2015. This is a backtest of that area as well. Having the failure appear at the backtest point as well as the confluence of these trendlines can only be considered as a major blow in the bull/bear debate.
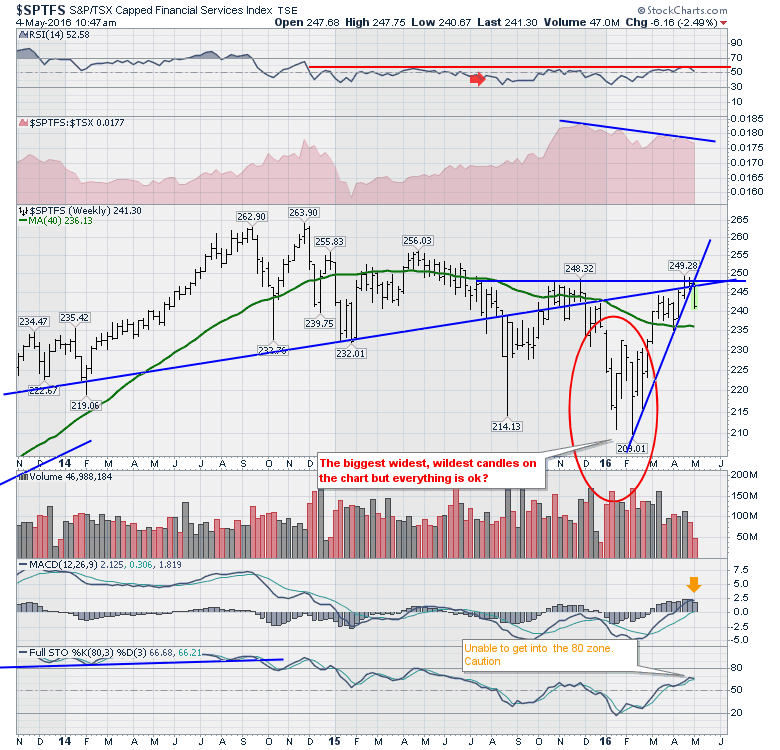
Staying with the chart above, the timid volume in April is concerning as well. The Banks were pushing to record highs, but no new buyers showed up to push the stocks higher. Now it appears the MACD is rolling over once again and the long-term Full Stochastics are also rolling over after failing to reach the 80 zone or a new bull market level.
One sector like the banks shown above does not make a new bull or a bear market. It is the broad confluence of information that makes it a new bull or bear market. The breadth charts shown early in the webinar were particularly bullish. That needs to be tempered with the data coming off these sector charts.
Here is the chart of the industrials. $SPTIN.
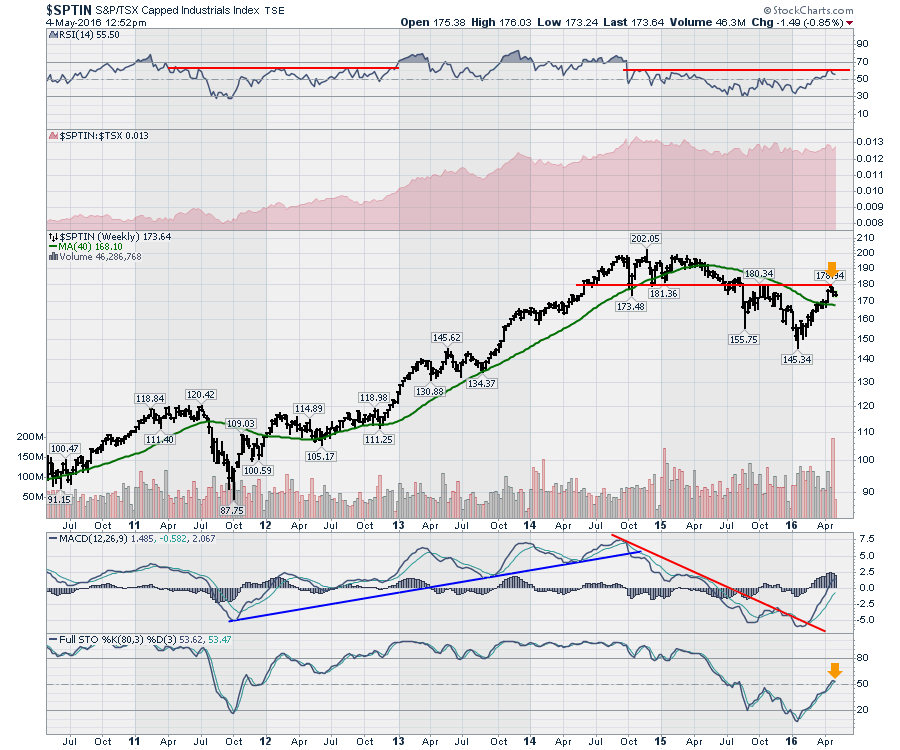 The huge volume spike was associated with Bombardier's new jet order announcement from Delta. That would be my take on it.
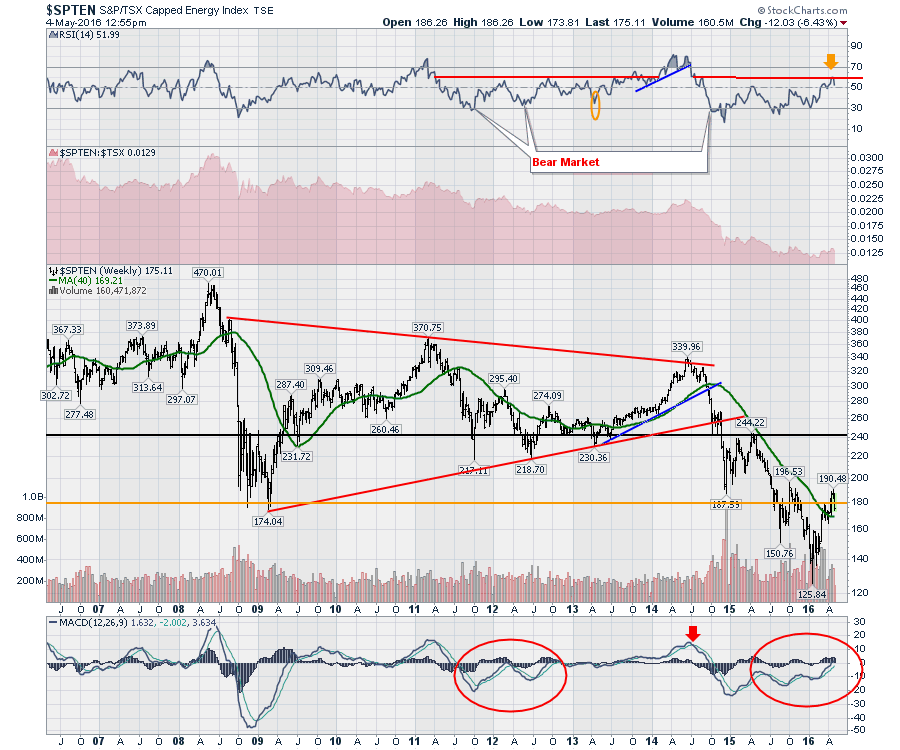
For the energy sector, it has been a significant run.
 Probably the most influential groups in the bull/bear debate are the consumer staples (defensive) vs. consumer discretionary (bullish).
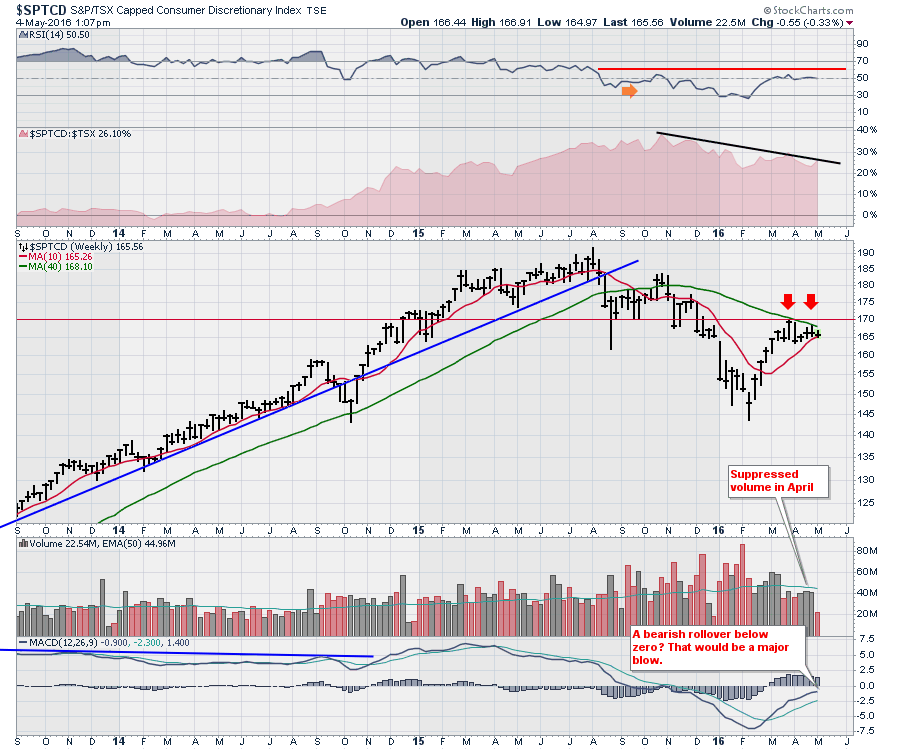
Here is the bull chart. The only problem is, it is not bullish! $SPTCD. The Consumer Discretionary group. The RSI is below the bear market level. The relative strength is a problem as it is trending down. The price stalls at the horizontal support/resistance level.
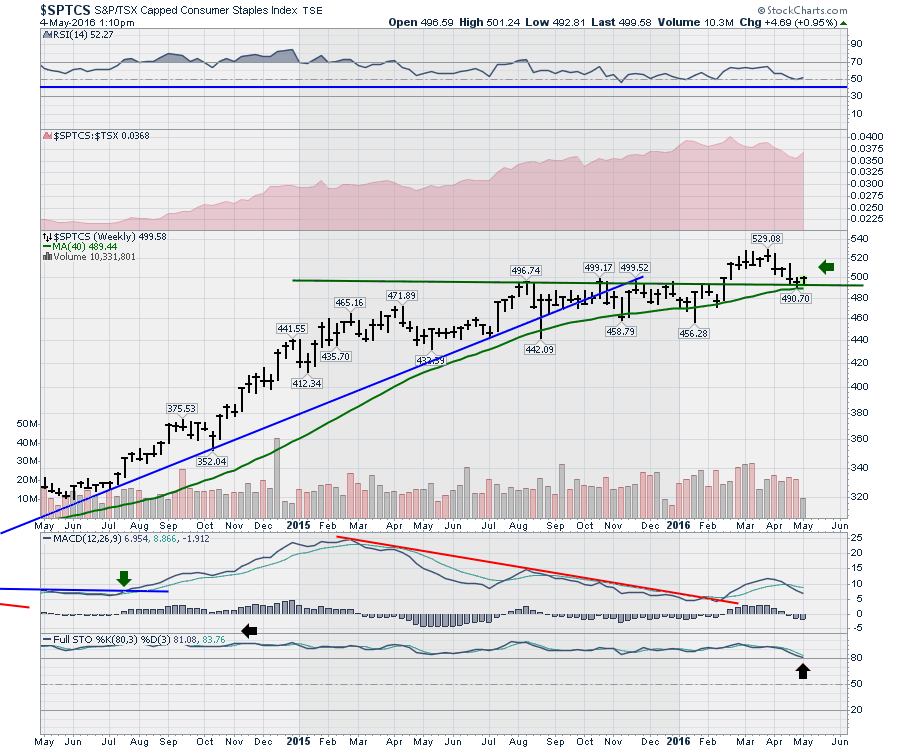
Let's look at the Consumer Staples so you can scroll between them. ($SPTCS). The RSI is stuck in bull-market mode. It has stayed above 40, bouncing up to 70. The relative strength is drifting down slightly, but maybe the chart can explain some of that. During the recent rally, this has pulled back. But it is in exactly the opposite position as the chart above. That was hitting resistance and failing, this chart is hitting support and bouncing. The MACD is well above zero, albeit with a lower peak on the last peak. The Full Stochastics are still above 80.
The bottom line is the bull market sits on a knife edge. This knife edge is defined as support/resistance. The growth-oriented businesses are breaking down. The defensive businesses are turning up. You can also watch the video for more information on the REITs, Income Trusts, and Utilities. Click on this link to watch the video. The Canadian Technician Live 2016-05-04.
Lastly, I'll be hosting the Commodities Countdown webinar on Thursday, March 5th. Follow the link to register. You can follow me on Twitter for some independent stock charts that are blurted out. @Schnellinvestor. Please click on the big Yellow button below to subscribe to this blog. You will have to do that with each blog that you wish to follow. While the webinar on Tuesday covered the global situation, I also covered that on last Thursday's Commodities Countdown 2016-04-28. Here is a link to the last Commodities Countdown blog article. If you think the lows in the Commodities are in, you might want to hit the big yellow Yes button at the bottom of that blog chain as well.
Good trading,
Greg Schnell, CMT, MFTA.


