One of the most difficult decisions in investing is selling the gift that keeps on giving. Stocks that have performed well for a number of months or years start to feel bulletproof. I scrolled through the $TSX components and noticed a couple of long-term charts that have generated zero over the last year after being a major outperformer.
The first is Constellation Software (CSU.TO). The stock chart looks like a long, long love story. Earlier this year, the SCTR broke down below 75 and stayed there. The stock is ripe for a long term investor to make a decision.
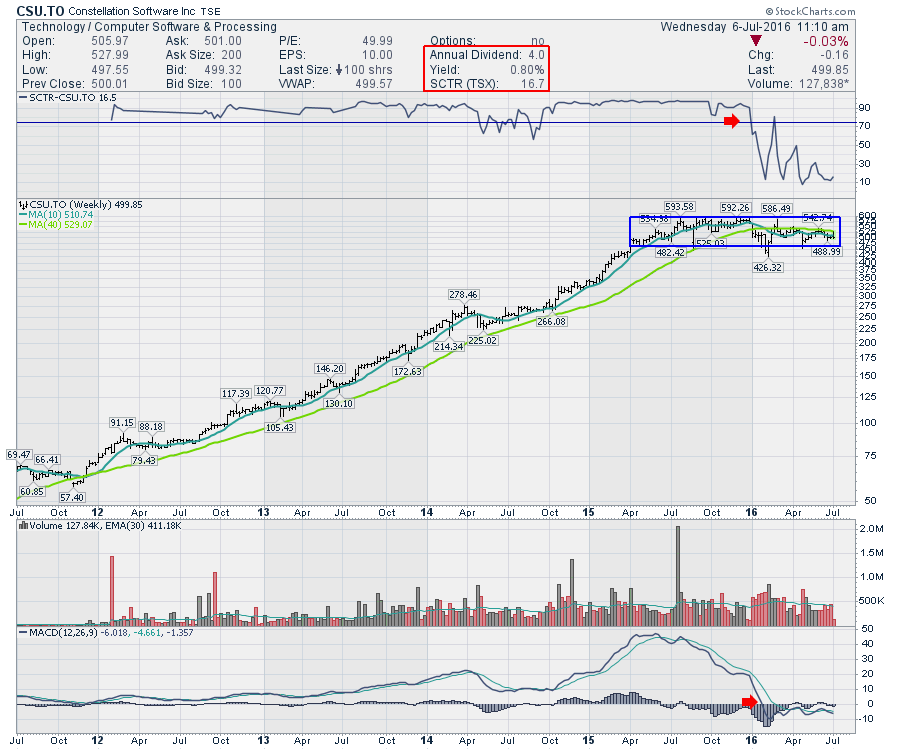
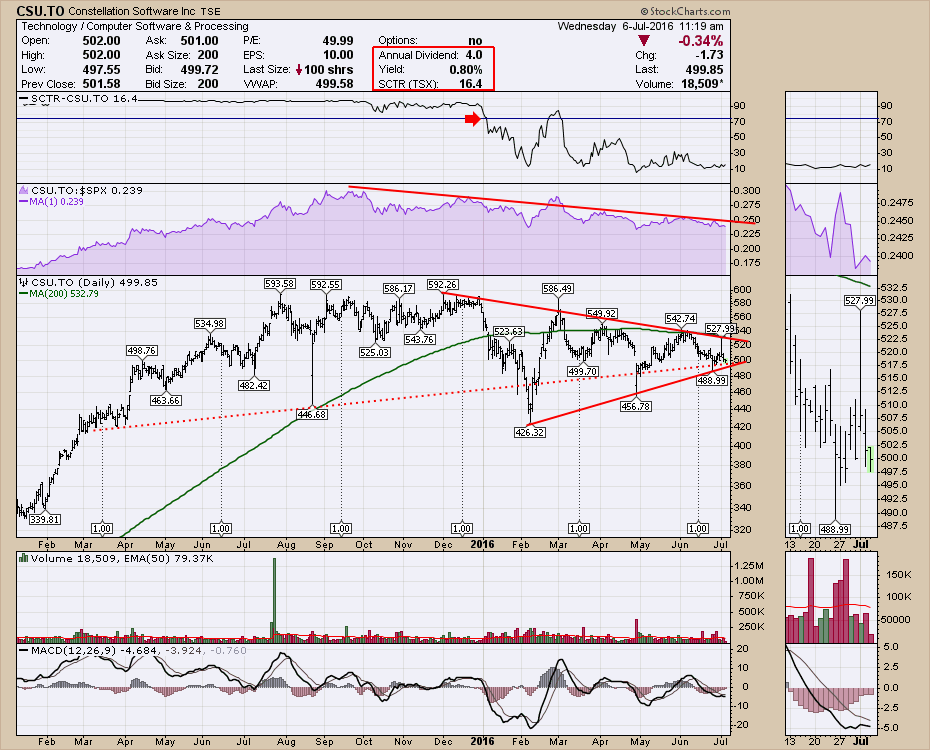
If the SCTR in this bullish stock (Constellation Software) cannot start behaving like a top performer, investors should recognize a major change in trend. Gearing down from weekly to daily, the importance of this level can not be underestimated. The SCTR is the same for weekly or daily, but it is weak. The S&P 500 Relative Strength in purple continues to drift lower. The real drama is on the price chart. The stock hit round number resistance at $600 and made a brief stab down to $425 for a low. So here we sit at $500 with two supporting trend lines and a downsloping trend line across the highs in the stock. The 200 DMA now is resistance and it is sloping down. The dividend at 0.80 % is hardly relevant as the daily stock movement is more than the dividend. I think a Friday close below $500 is a meaningful exit and the stock would have to reignite the SCTR to make me get interested again.
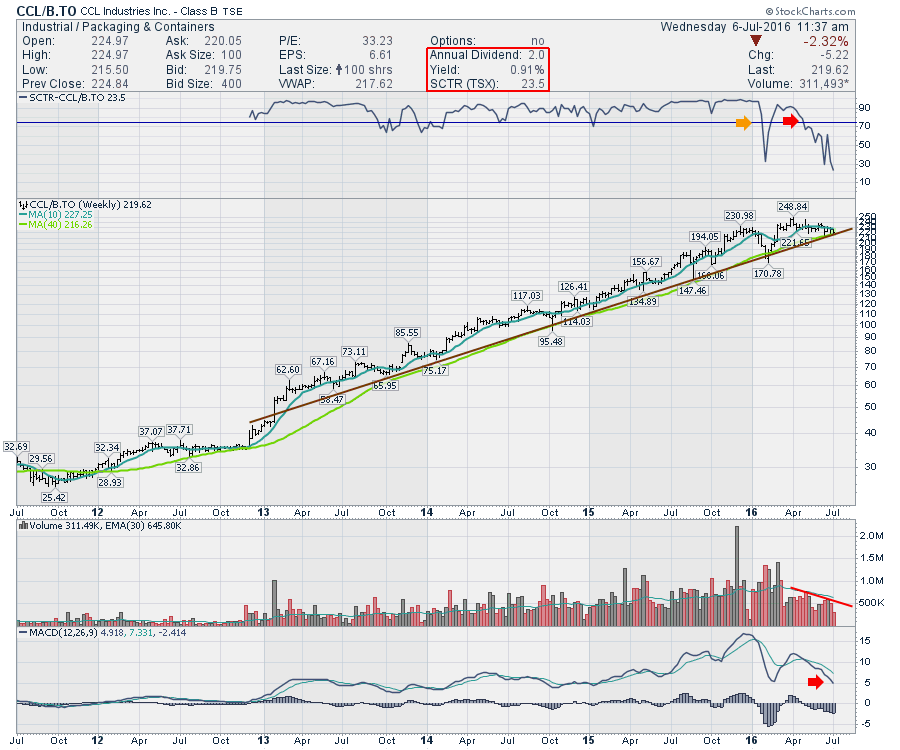
 The next stock that looks weak is CCL Industries (CCL/B.TO). The stock price performance is at the worst level in 4 years according to the SCTR. When institutions stop supporting the price in the previous trend, it is important that investors understand the trend change. In this case, the SCTR fired off a warning shot on the February lows, and now it has confirmed it. The stock is behaving worse that 75% of the stocks on the $TSX so you can probably expect institutions to be selling this core holding. Once again, the dividend is irrelevant as the daily volatility is higher than the dividend. The SCTR let go three months ago, but the message from the CSU.TO chart above is the same. This will probably trend lower. If there is no dividend and no capital gain to be achieved, why continue to hold the stock?
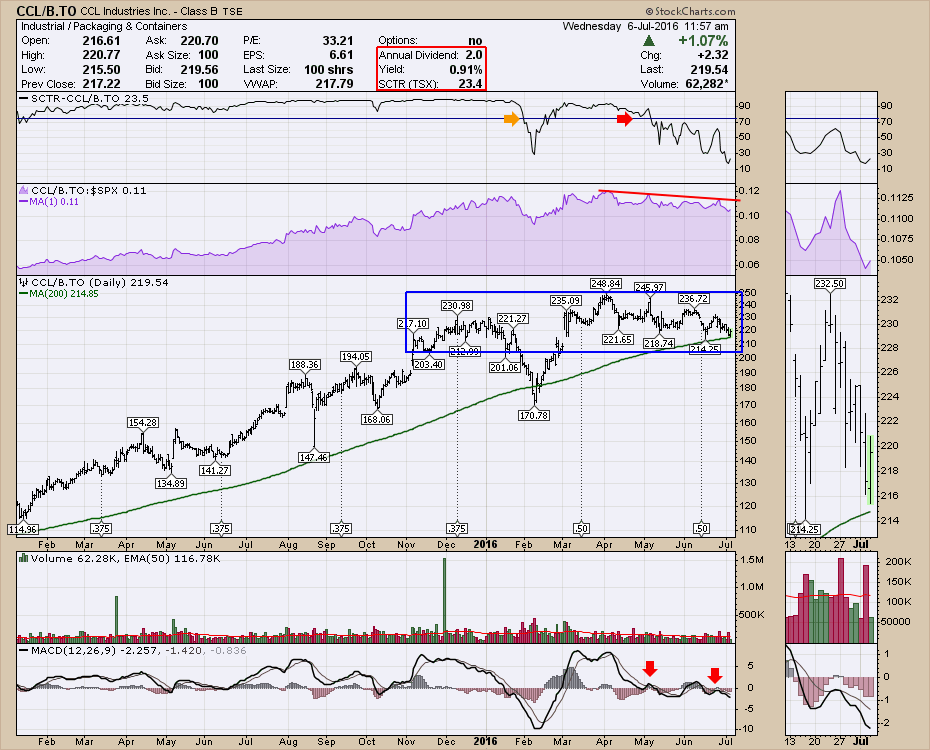
 The SCTR has changed behavior when we look on the weekly or the daily (below) for CCL/B.TO. The SCTR was clearly one of the best performing stocks but now it has become one of the worst performing stocks. This is a change in investor attitude. While this topping process is earlier than on the Constellation Software example above, it does suggest this stock will probably lose the support of the 200 DMA.
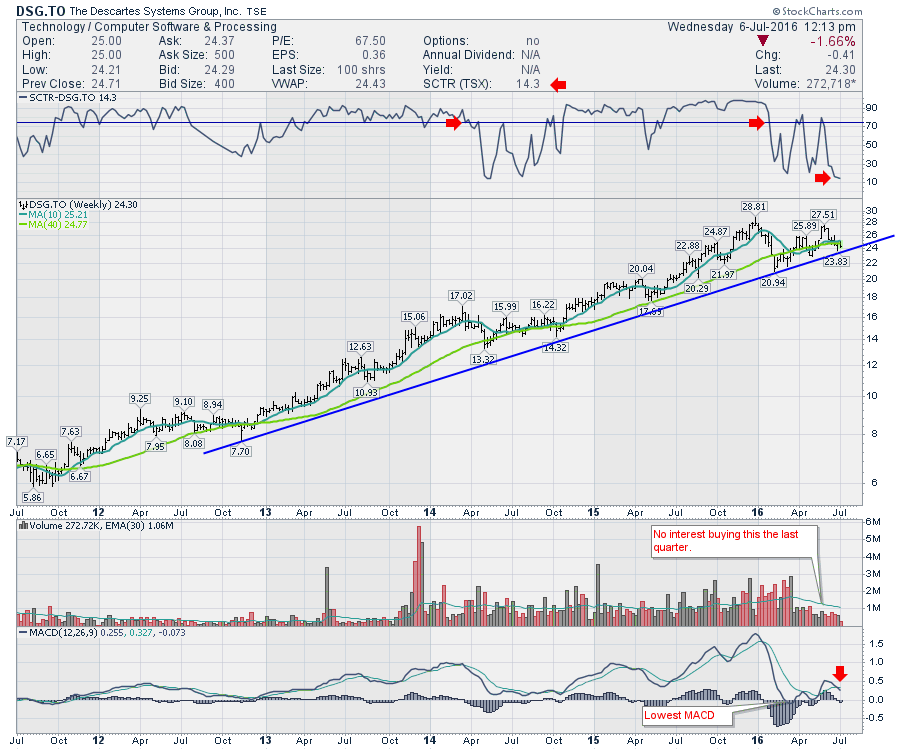
 Descartes Systems (DSG.TO) is showing the same symptoms as the other two stocks shown above. The SCTR is reaching the lowest point on the chart. The stock had a similar wobble in 2013 on the SCTR. Will it work out the same way? A couple of things make me believe that it does not. The volume signature shows no buyers showing up for work. The MACD made the lowest low in the last 4 years on the chart. Recently, multiple rally attempts continue to fade as shown by the MACD.
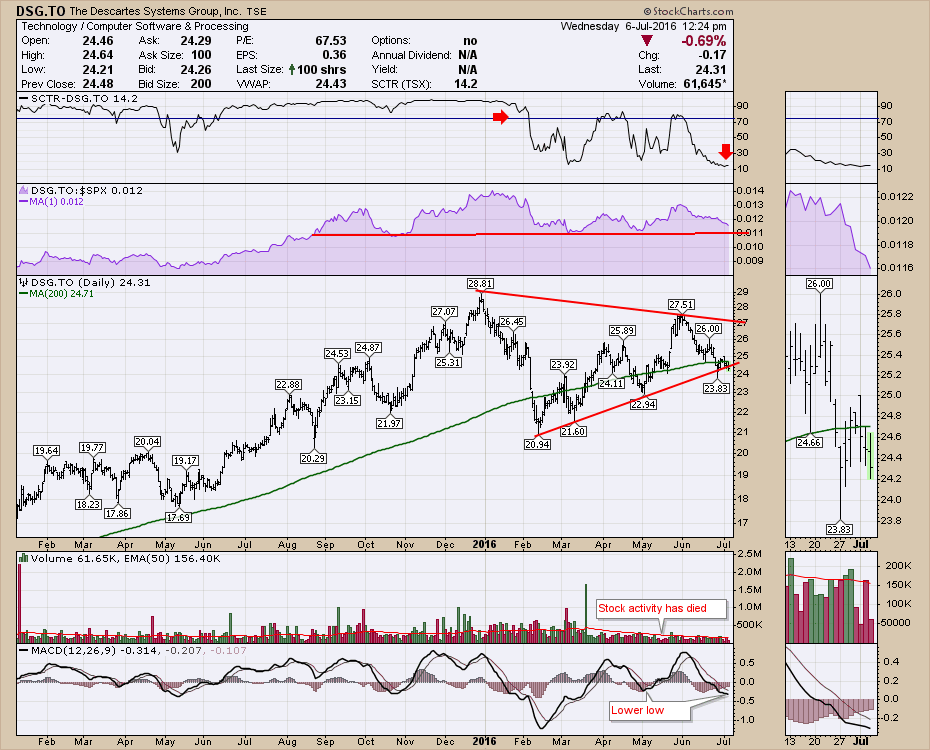
 Here is the daily version of Descartes Systems (DSG.TO). The daily has some similar data, but as the price tries to find support at the 200 DMA, this becomes an extremely important level for Descartes. The SCTR is at the lowest level and we can see the smooth deceleration of the price since June 1. The Relative Strength is near but above 10-month lows. While we are entering the earnings period for the second quarter, I would be shy to own this here or at least have an exit strategy if it continues to weaken. At this point the stock has to return to being a top performer or the selling pressure will increase. We can see the price is testing the red support trend today.
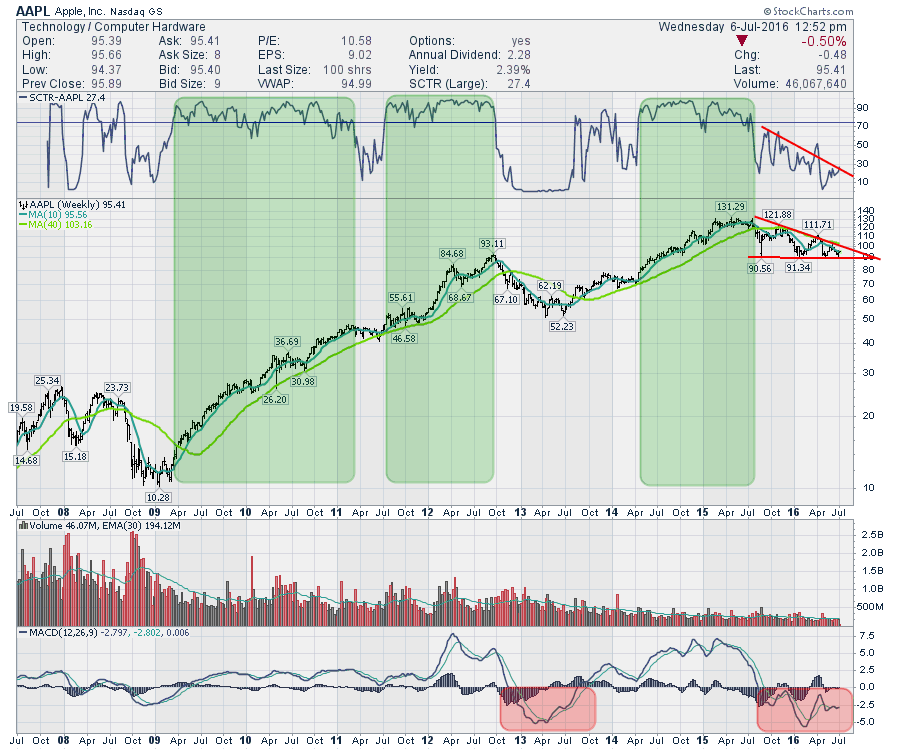
 SCTR's can help you recognize a change in investor sentiment in the stock before it falls apart. The most widely traded, populist, momentum-based stock in the US is Apple (AAPL). The SCTR has been very timely on the stock in general.
 I find the SCTR a very helpful indicator. I would encourage you to look at the SCTR as a part of your decision arsenal. In the meantime, owners of Constellation Software, CCL Industries, and Descartes Systems may want to decide if they should stick around as my indicators point to leaving. Each to his own as that's what makes a market!
Good trading,
Greg Schnell, CMT, MFTA.
