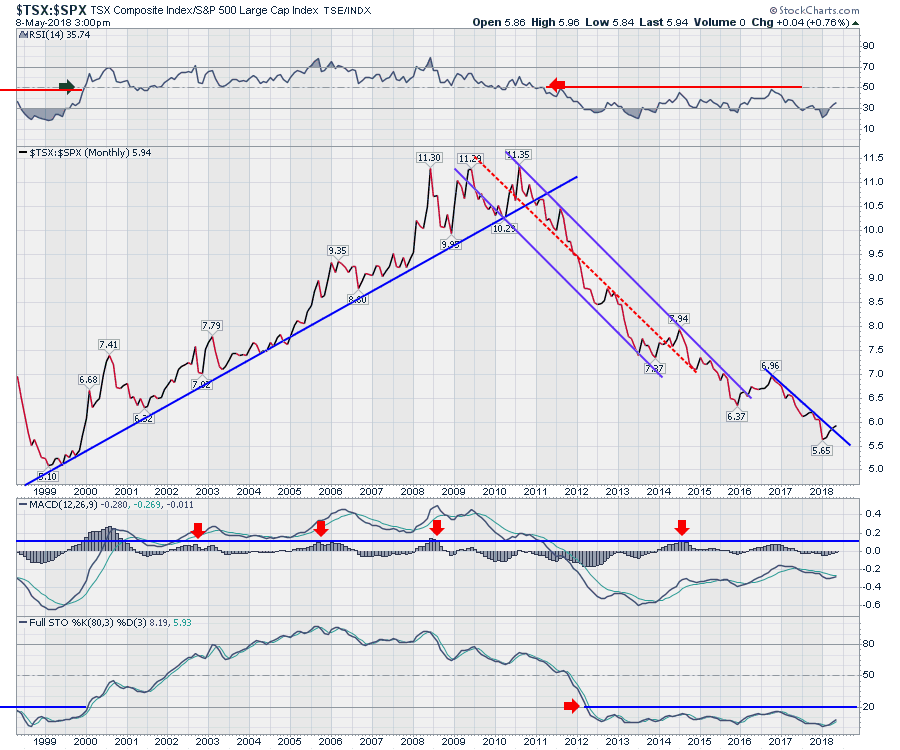
The Canadian market has been underperforming for a while. This week some clues of change started to show up. First of all, for the first time since 2016 the Canadian market broke a downtrend compared to the $SPX. Obviously, it is just barely breaking a downtrend, not turning higher yet. However, you can see on the left side of the chart, that when Canada outperformed for the first decade this was a worthy signal to be aware of. It was also a good signal to be in Commodities in early 2016. I discuss this chart at length on the video.
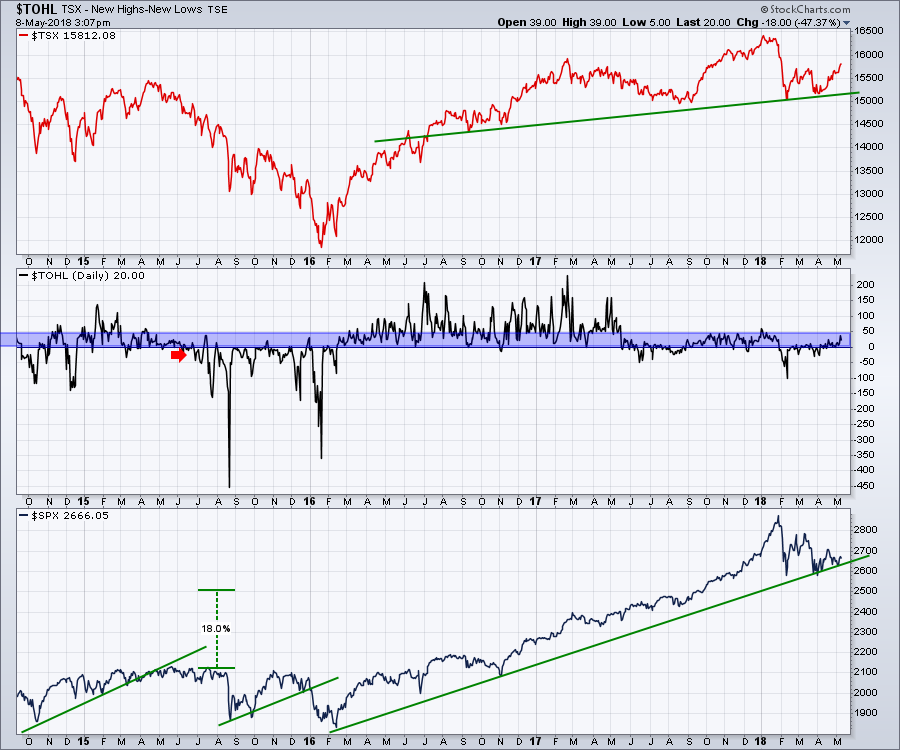
One thing that still needs to improve in the Net New highs. You can see on the chart that if we can't get above 50 per day, that usually suggests the market doesn't have enough power in the rallies. But it needs to start somewhere and right now this is trending higher.
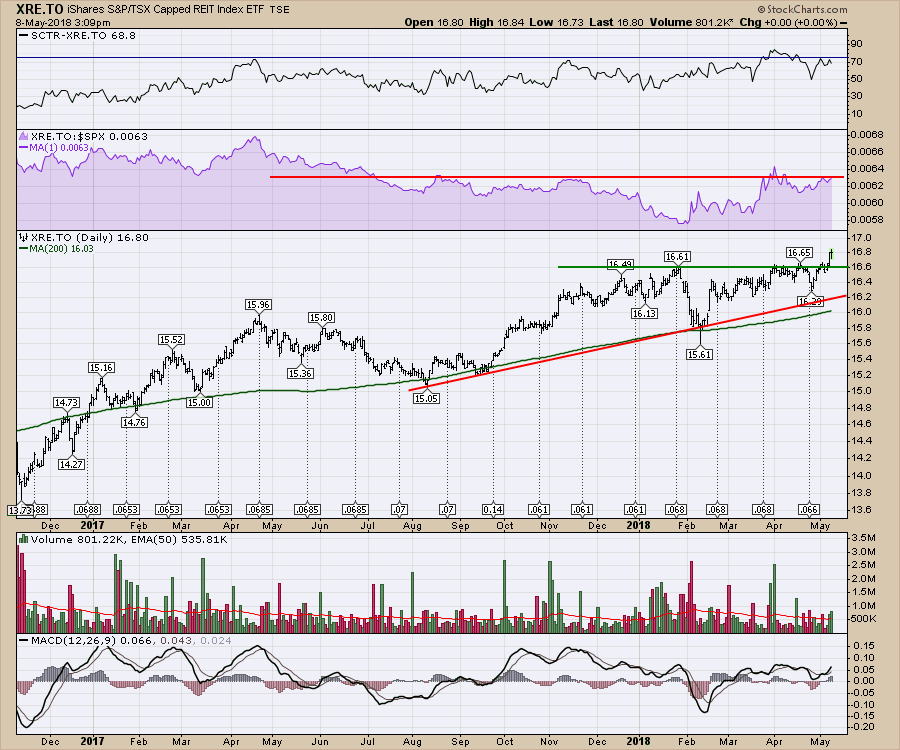
 Some of the interesting sectors this week are the REIT's and Income Trusts. This is the REIT ETF.
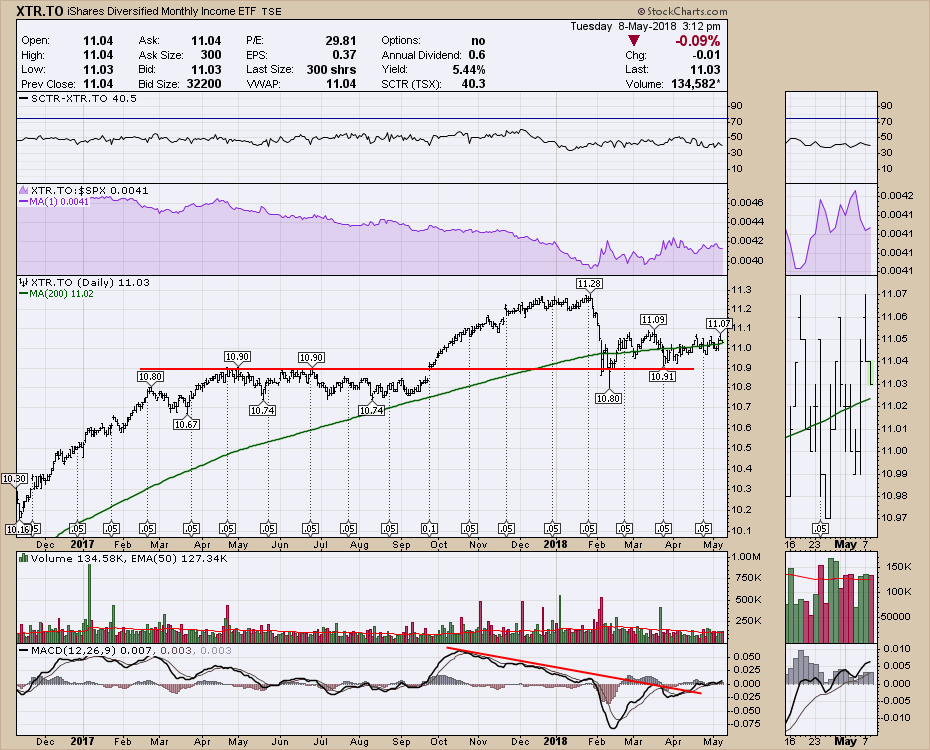
 With the MACD above zero and the chart trying to push higher, this Income Trust ETF might have room to run.
 The Technology sector looks good, but the Telecom stocks need to make an important base here. I discuss this quite heavily in the video recording.
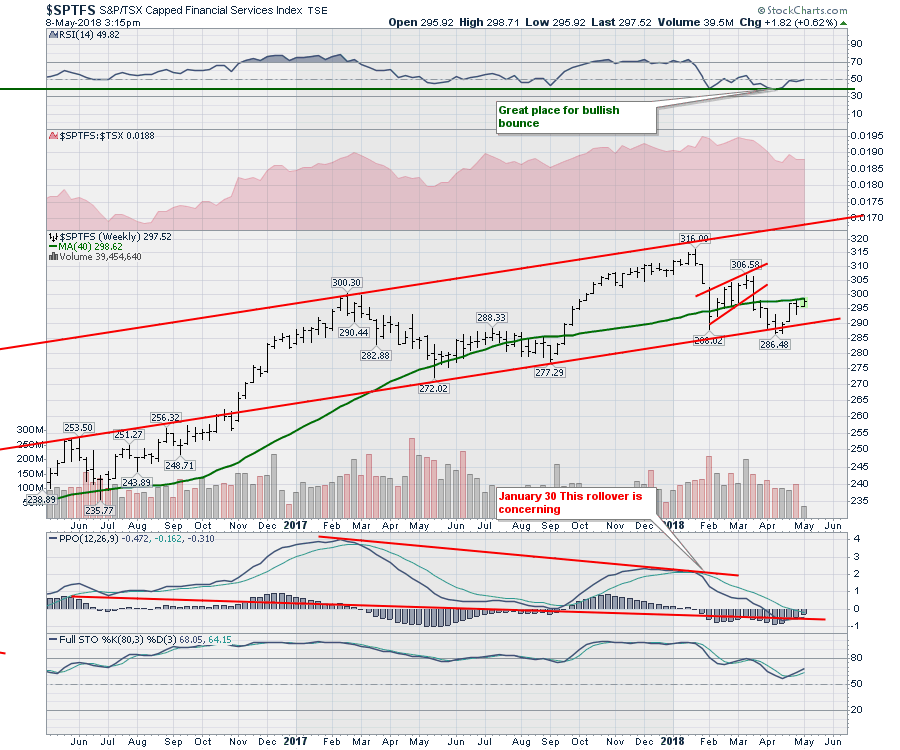
The Financials are starting to improve. The RSI bounced at 40 which is a bull market trait. The shaded area shows the Financials performance relative to the $TSX. Unfortunately it is still down trending. The Full Stochastics on this weekly chart have started to turn up but the MACD has not gone positive yet.
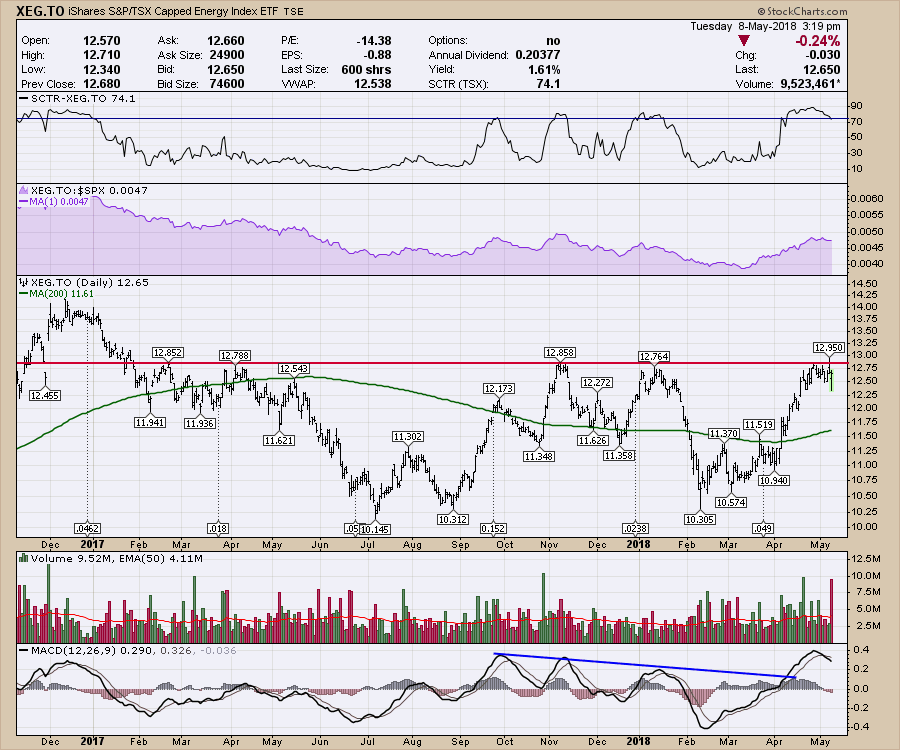
 Energy is stuck at horizontal resistance. We'll keep watching to see if it can break through.
 So lots of bullish signs with Canada starting to behave stronger than the USA. That is particularly nice to see. I have a lot of information tucked into the recording this week, so hopefully you'll find some helpful information there.
Good trading,
Greg Schnell, CMT, MFTA

