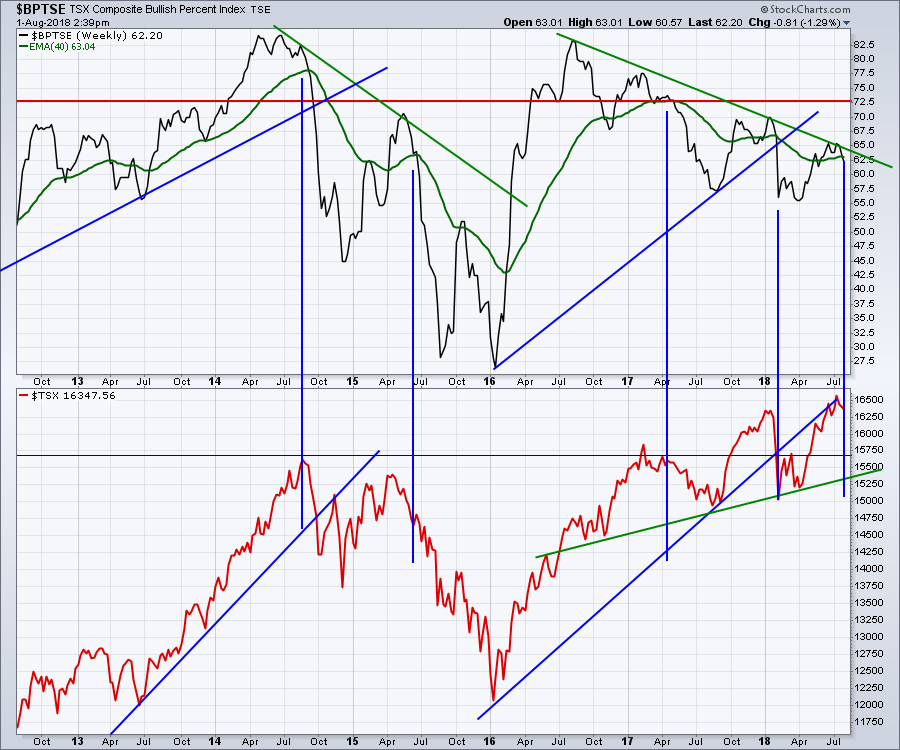
Canada continues to move higher on lower breadth. This is the Bullish Percent Index in the top panel. The chart shows the percentage of stocks that are on a buy signal. Notice the drop each time the market rallies. Each time we move below the moving average the market retracts.
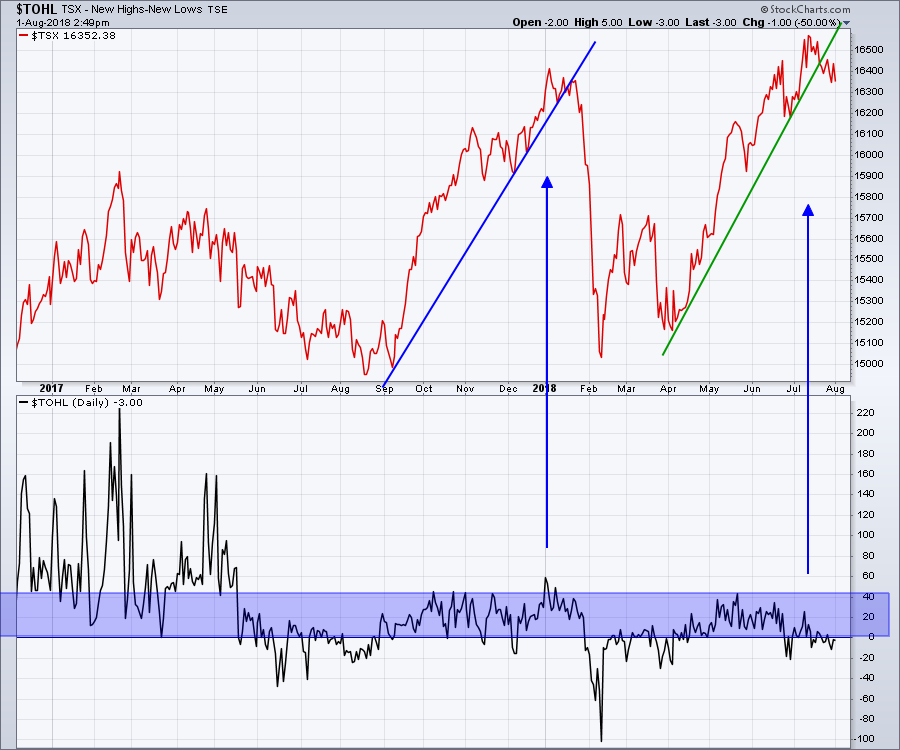
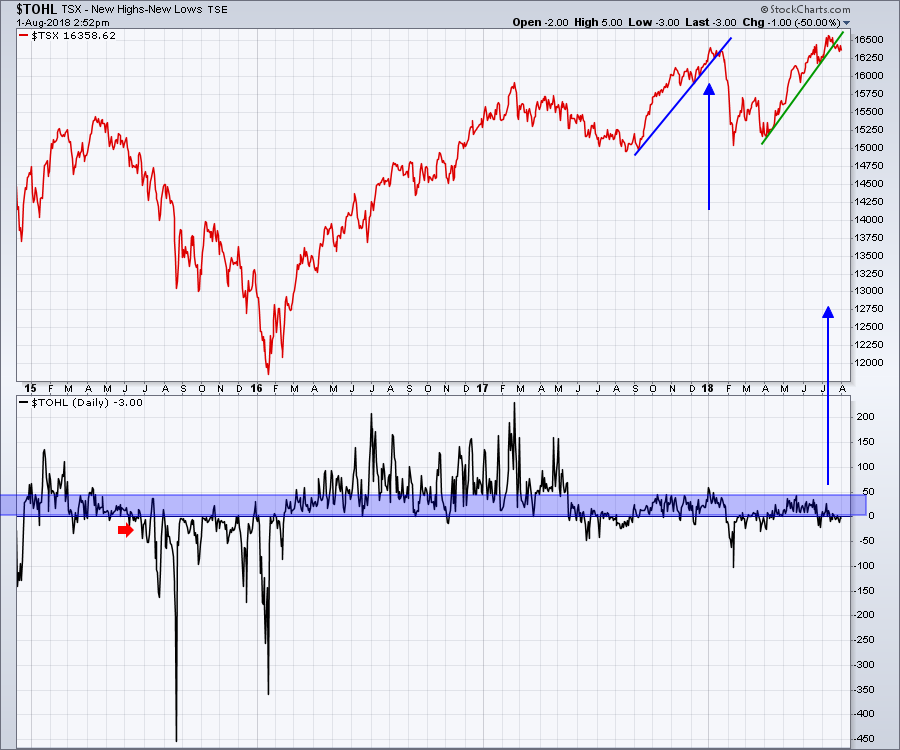
The number of stocks making new 52 week highs is currently less than the number of stocks making new 52 week lows. At the recent high, we had fewer stocks making new highs compared to January highs.
 The chart below is the same as the chart above, but you can see how a real strong bull market has more breadth with lots of stocks making new highs.
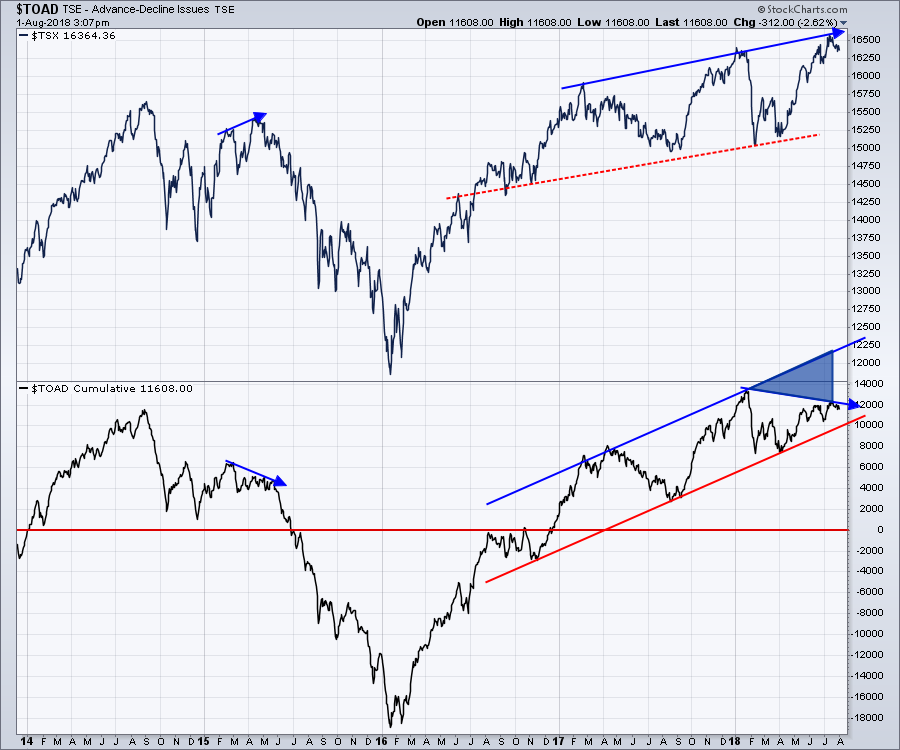
 We are also seeing a divergence on the Advance /decline data. While this could improve and change the chart shape, that seems unlikely with more stocks making 52 week lows than highs.
 On this weeks video, I cover off the sectors and a global review. India looks great, but China, South Korea and Indonesia all look concerning.
Below is the recording of The Canadian Technician Video.
Below is the recording of The Final Bar show.
Below is the Commodities Countdown video that walks through the concerns in the index set up right now.
If you are missing intermarket signals in the market, follow me on Twitter and check out my Vimeo Channel often. Bookmark it for easy access!
Good trading,
Greg Schnell, CMT, MFTA
Senior Technical Analyst, StockCharts.com
Author, Stock Charts for Dummies
Want to read more from Greg? Be sure to follow his two StockCharts blogs:
Commodities Countdown and The Canadian Technician


