There were few places to hide in this week's tsunami of lower prices. Commodities had a lot of ominous moves, Copper broke down and Oil suffered a massive 11% down week. Rare earth metals, such as Lithium, Steel and Aluminum, all moved lower. Individual sectors plummeted, with Utilities down the least. While it might out-perform in a downtrend, your account is still lighter in the end. There's been a lot of discussion about the Dow Jones Industrial Average breaking down this week to confirm the breakdown in the Transports, but it seems a little late for a confirmation after a 20% move on most of the indexes.
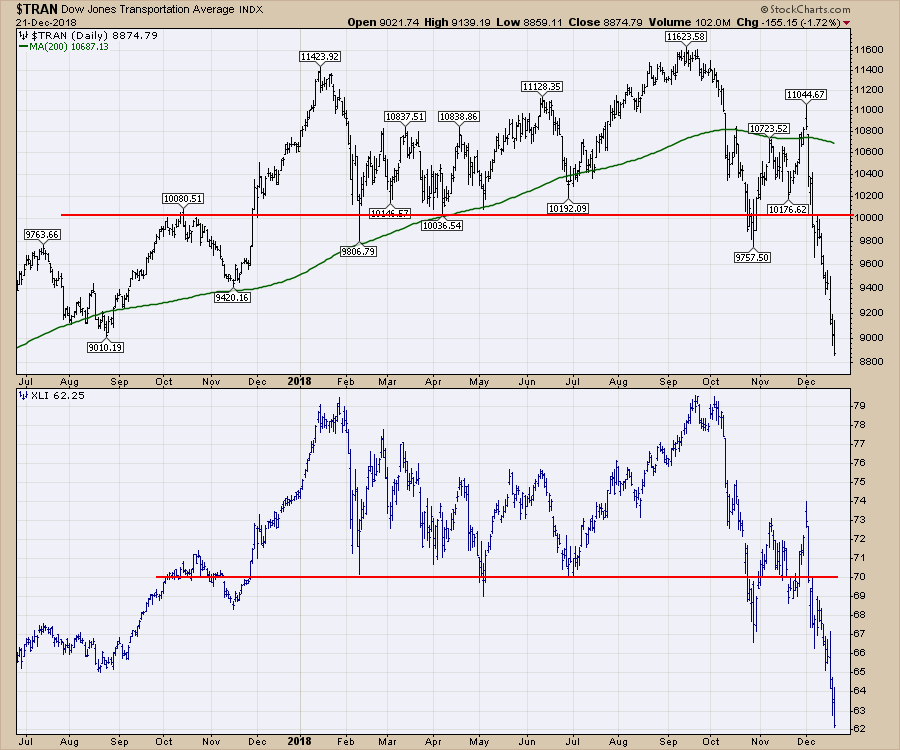
In true Charles Dow spirit, comparing the Industrials sector (XLI) rather than $INDU with the Transports makes more sense. These charts nearly interchangeable, with only some subtle differences near the highs. Any way you slice it, the Charles Dow methodology has broken down.
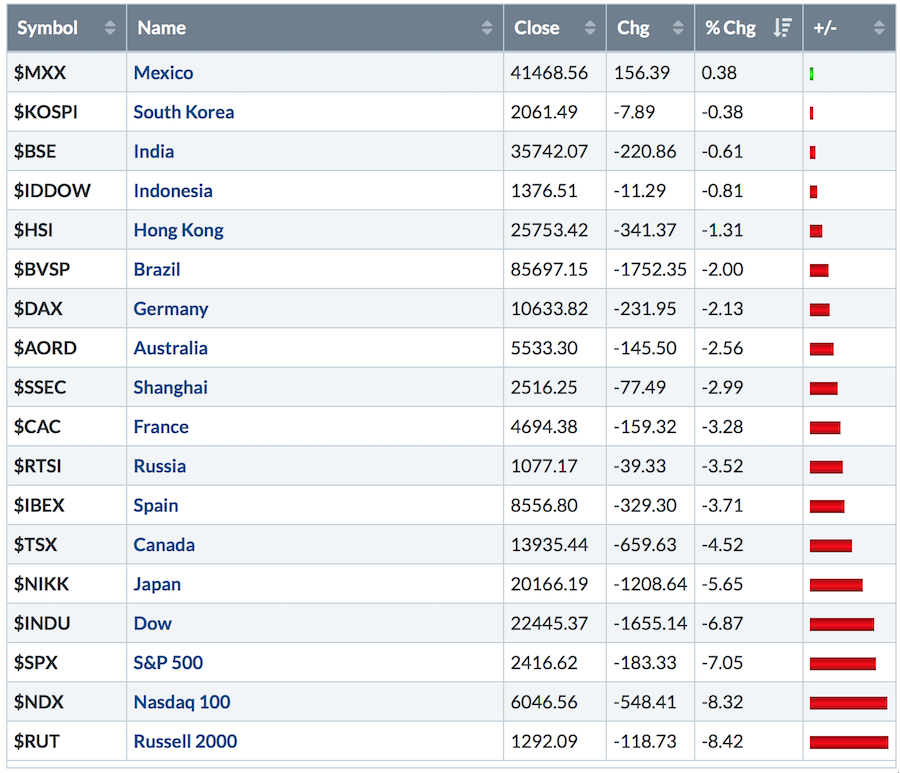
 Most markets have broken down below support. This week, the USA led the way on the down move. Some of the emerging markets charts have been outperforming recently, but that's a relative term - none of the charts are breaking out to new 3-month highs, as an example.
 Back in October, I published an article that showed charts showing signs of a larger market breakdown. In spite of that, though, I sure did not expect the tenacity of this move.
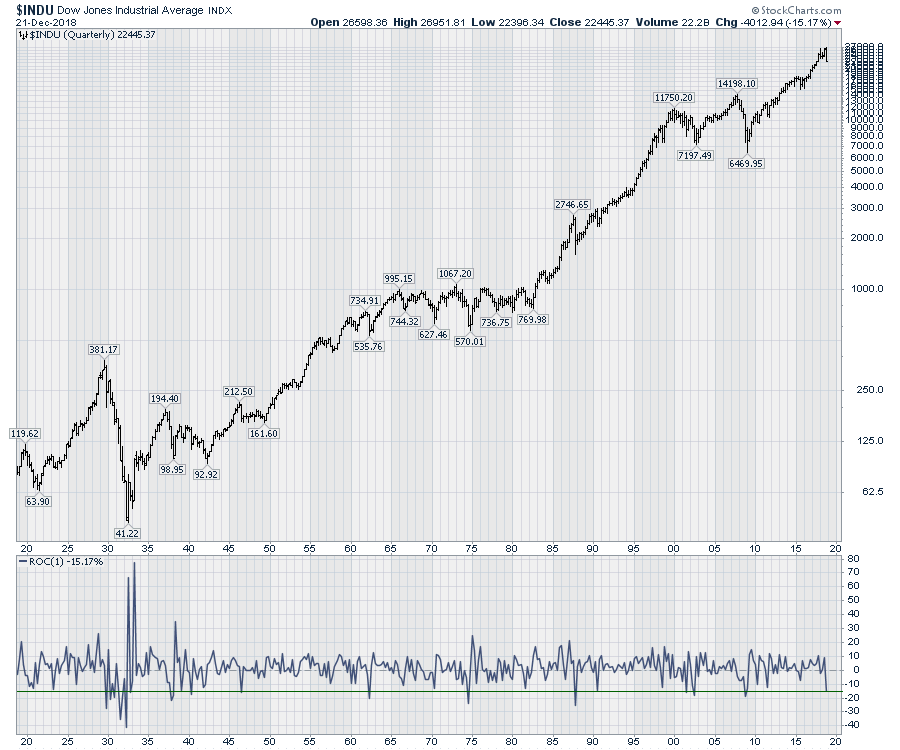
The chart below shows the last 100 years of the Dow Jones Industrial Average. This is one of the worst quarters in the century. While most of the wild swings were back in the 20's and 30's, this is one of the biggest moves in the last 80 years percentage-wise. There is roughly one big quarter like this every 10 years, but this is quite similar to the moves in 2008. Look at the 1-period rate of change on the lower panel.
Lots more on this weekend's market wrap.
On The Final Bar, I mentioned a lot of negative sentiment indicators. If you are not familiar with sentiment indicators, you may find this video helpful. There are some other charts to take note of as well.
The Canadian Market Review goes through the significant breakdowns on the charts and what to look for.
For those of you looking for a small gift, you might have some family or friends that would like to learn more about the basics of charting; if so, they'll love Stock Charts for Dummies. The first section of the book walks through all the chart settings to get the charts you want, the second section explores why you might use charts for investing and the third section is about putting it all together.
Click here to buy your copy of Stock Charts For Dummies today!
If you are missing intermarket signals in the market, follow me on Twitter and check out my Vimeo Channel. Bookmark it for easy access!
Good trading,
Greg Schnell, CMT, MFTA
Senior Technical Analyst, StockCharts.com
Author, Stock Charts for Dummies
Hey, have you followed me on Twitter? Click the bird in the box below!
Want to read more from Greg? Be sure to follow his StockCharts blog:
The Canadian Technician


