In this article, I'll be covering some of the sentiment charts for the broad market.
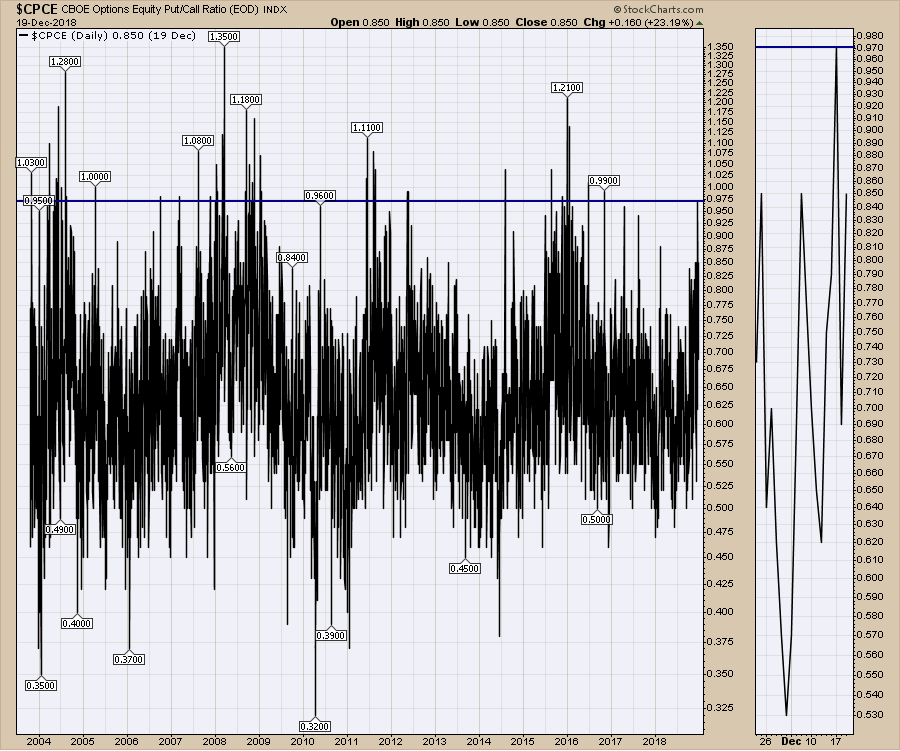
The Equity Put Call ratio ($CPCE) is experiencing in the top 40 spikes of the past 15 years. Take notice of the groupings - the majority are bunched around major market lows. While this doesn't look very severe, remember that quadruple witching happens tomorrow. This is an options-related event that happens every three months; typically, those dates are some of the highest-volume days of the year. Thus, extreme volume this week, with a lot of protective put buying, suggests we are near a turning point.
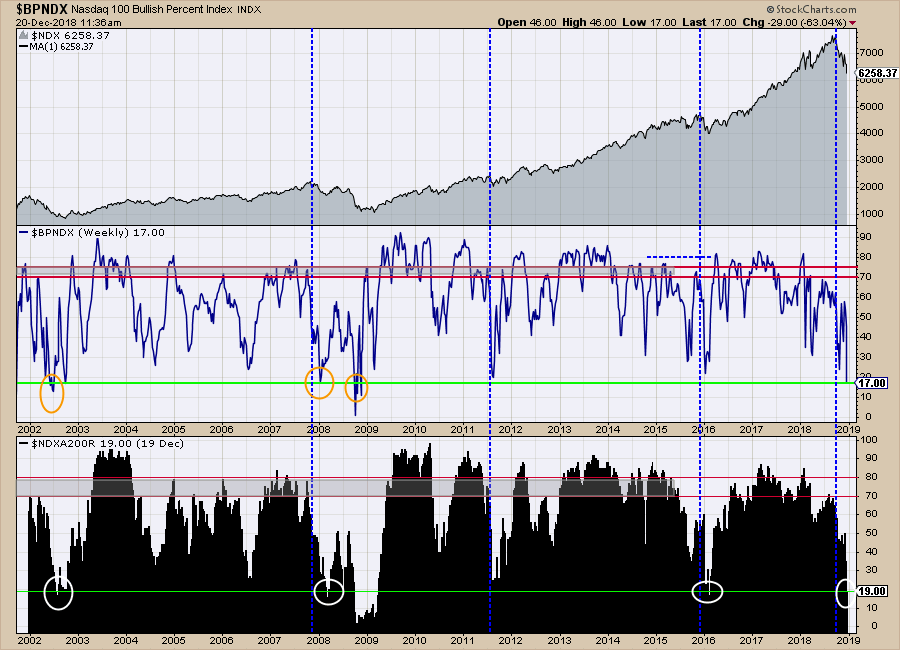
 Looking at the breadth charts, you may notice some extreme low levels being hit that have only been reached on major turning points. As seen on the NASDAQ 100 chart, the $BPNDX has only reached this level twice, aside from the collapse of Lehmann Brothers. Looking at the percentage of stocks above the 200-day moving average ($NDXA200R), these levels marked the major lows of 2002, the first down thrust in 2008 and the low of 2016. Clearly, those are major tradable lows.
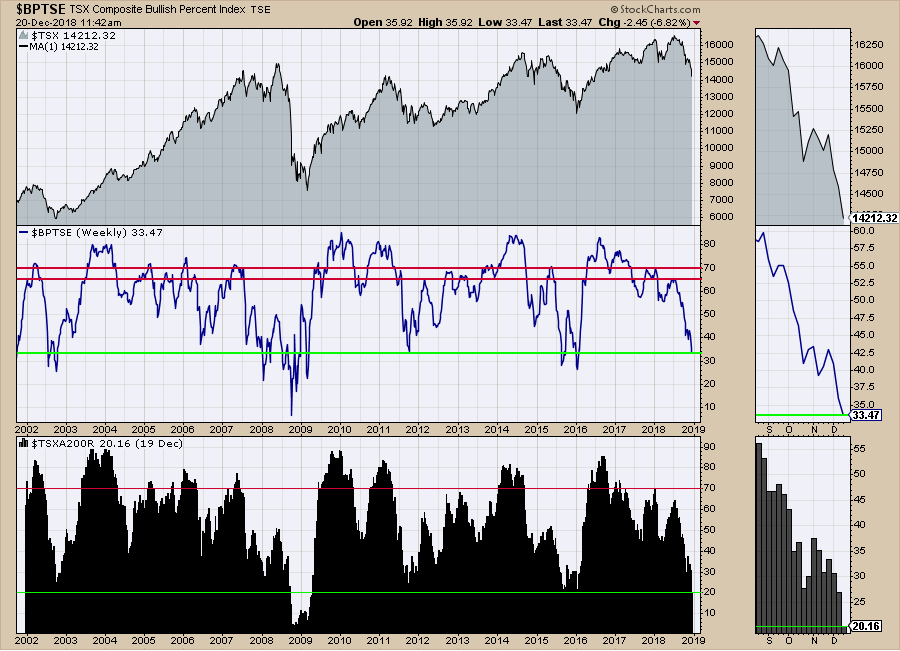
 For Canadian investors, the same chart layout shows some serious extremes. While the $BPTSE has been this low 5 or 6 times, the percentage of stocks above the 200 DMA ($TSXA200R) has only been lower at 2008 crisis levels.
 The $VIX is at 28 this morning of December 20th. Everyone seems to be hoping for a $VIX above 30 to get a conclusive buy signal. The market is rarely that kind to give you every signal in the book, but it may still happen.
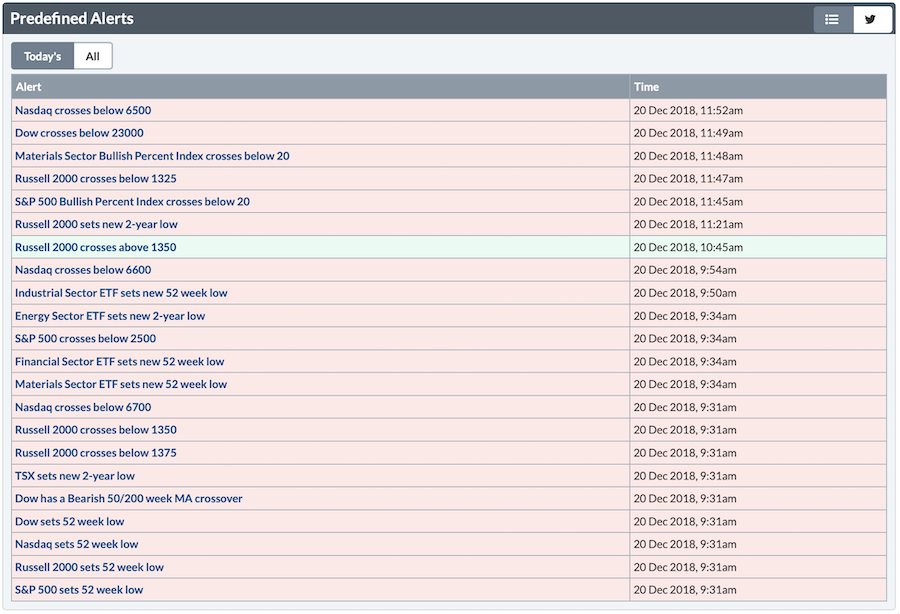
The predefined alerts are forming a stream of red.
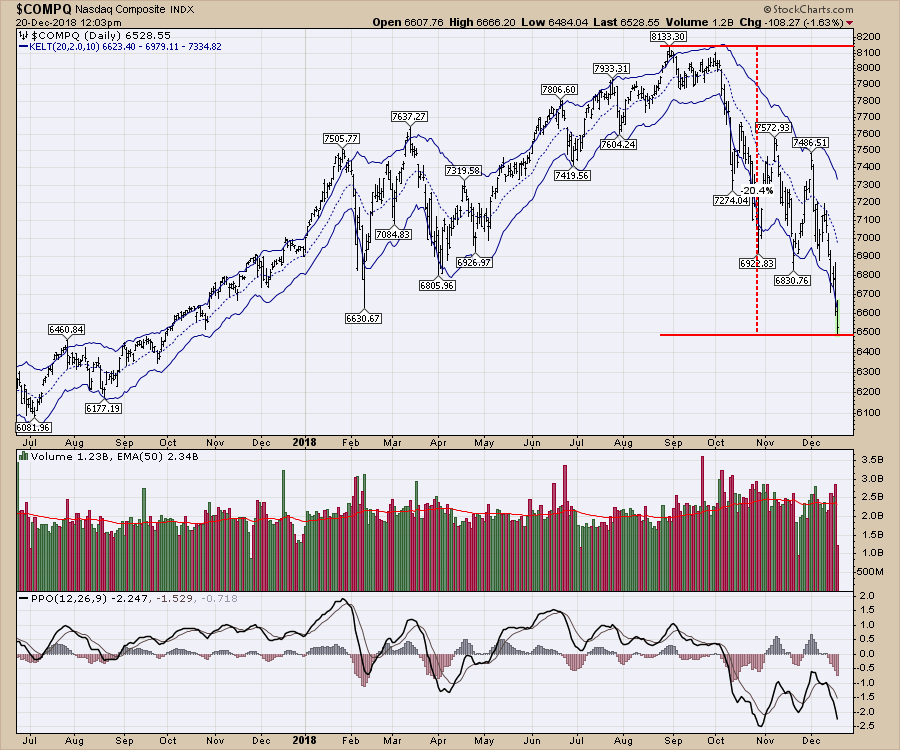
 Now that the market crooners like me are discussing the NASDAQ being down 20%, I should note that this is well outside the Keltner channels once again.
 In summary, the market seems to have everyone scared now. That helps make a bottom.
The video attached is the Canadian market overview for December 19th. There are lots of bearish charts on the screen and I would encourage you to check them out. The charts not covered fully on the video are the sentiment charts that are at historic market lows. Rather than carrying a big negative sentiment into Chartmas, the rare depths that these charts have achieved suggest the potential for a rebound, rather than further downside.
I have been discussing the gold setup for weeks now, but the breakout seems to just be getting started. In the video, I work through gold and would encourage you to view this setup in detail.
This Final Bar video shows some concerning charts. However, getting ready for the next rally is key.
For those of you who are looking for a small gift, you might have family or friends that would like to learn more about the basics of charting; if so, they'll love Stock Charts for Dummies. The first section of the book walks through all the chart settings to get the charts you want, the second section explores why you might use charts for investing and the third section is about putting it all together.
Click here to buy your copy of Stock Charts For Dummies today!
If you are missing intermarket signals in the market, follow me on Twitter and check out my Vimeo Channel. Bookmark it for easy access!
Good trading,
Greg Schnell, CMT, MFTA
Senior Technical Analyst, StockCharts.com
Author, Stock Charts for Dummies
Hey, have you followed me on Twitter? Click the bird in the box below!
Want to read more from Greg? Be sure to follow his StockCharts blog:
The Canadian Technician


