The US market continues to fight off China trade issues and the global slowdown. That's the good news, anyway. The bad news is the market holds a setup similar to last year's oscillation where it broke down. Over the past week, the major tech stocks came to rest near the up-sloping trend lines off of the December lows. The majority of stocks rallied off the trend line; that has to be considered good news, as they all looked pretty weak.
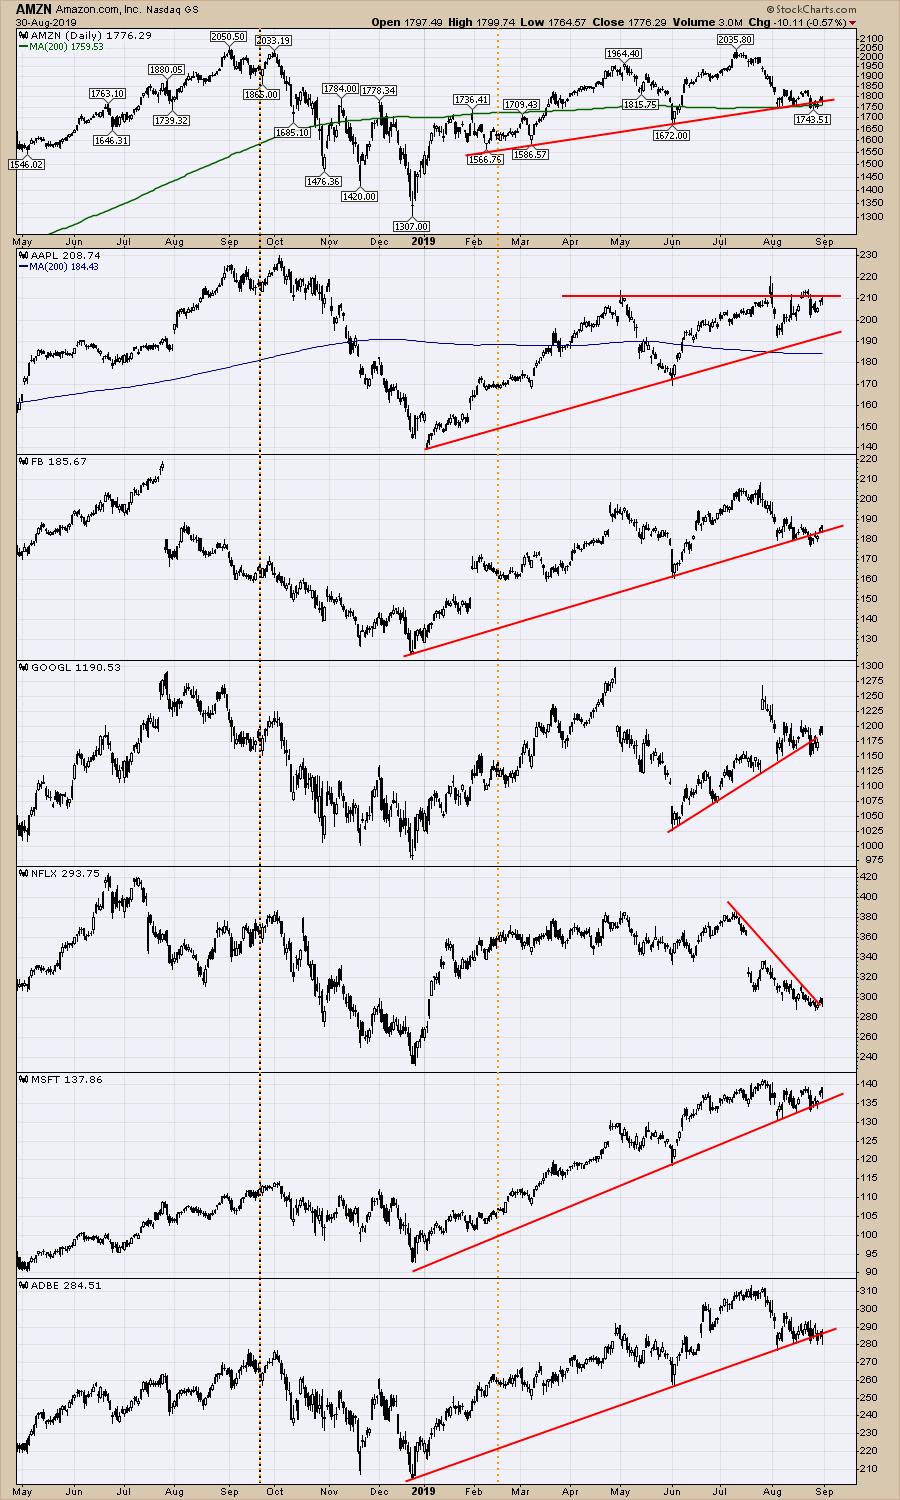
If the large cap tech names can't rally, that would be a problem for the market cap-weighted indexes.
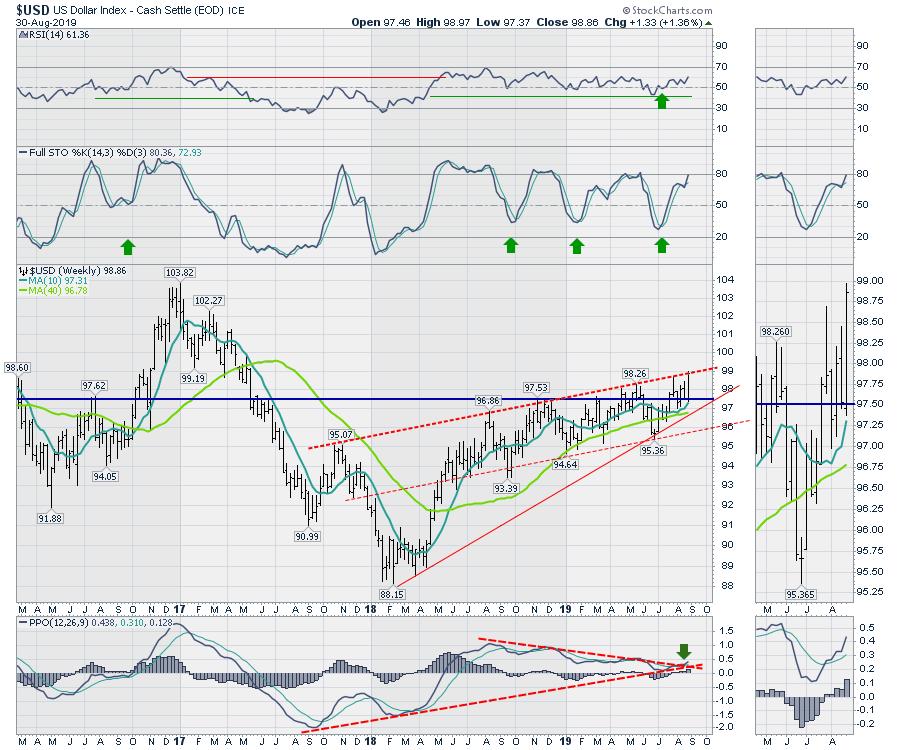
Amazingly, the US Dollar actually made and held a decisive move to the top of the range. Could it trend for a change, rather than just wallowing around in a sideways-to-slightly-up range? The range for this week was 1.5 cents, which is massive for the Dollar. What makes that move more important is that it is back to the top of the range. While I would expect a sudden surge in the US Dollar to be bearish for the large-cap international companies, looking left shows a surging US Dollar back in 2016 just as the stock market started a major move with the November 2016 Fed move and the election. What also looks similar is the PPO getting down near zero, then turning up. While I have been expecting a rising dollar for a while, this week the PPO broke the down trend, suggesting the dollar is ready to surge. Note the green arrow on the PPO momentum indicator.
What was also prominent this week was an up move in a lot of commodity-related stocks with a rising US Dollar. That certainly is not the main expectation with a rising Dollar, but the soothing words from China suggesting they were looking to calm the waters on the trade hostilities gave commodity stocks a lift.
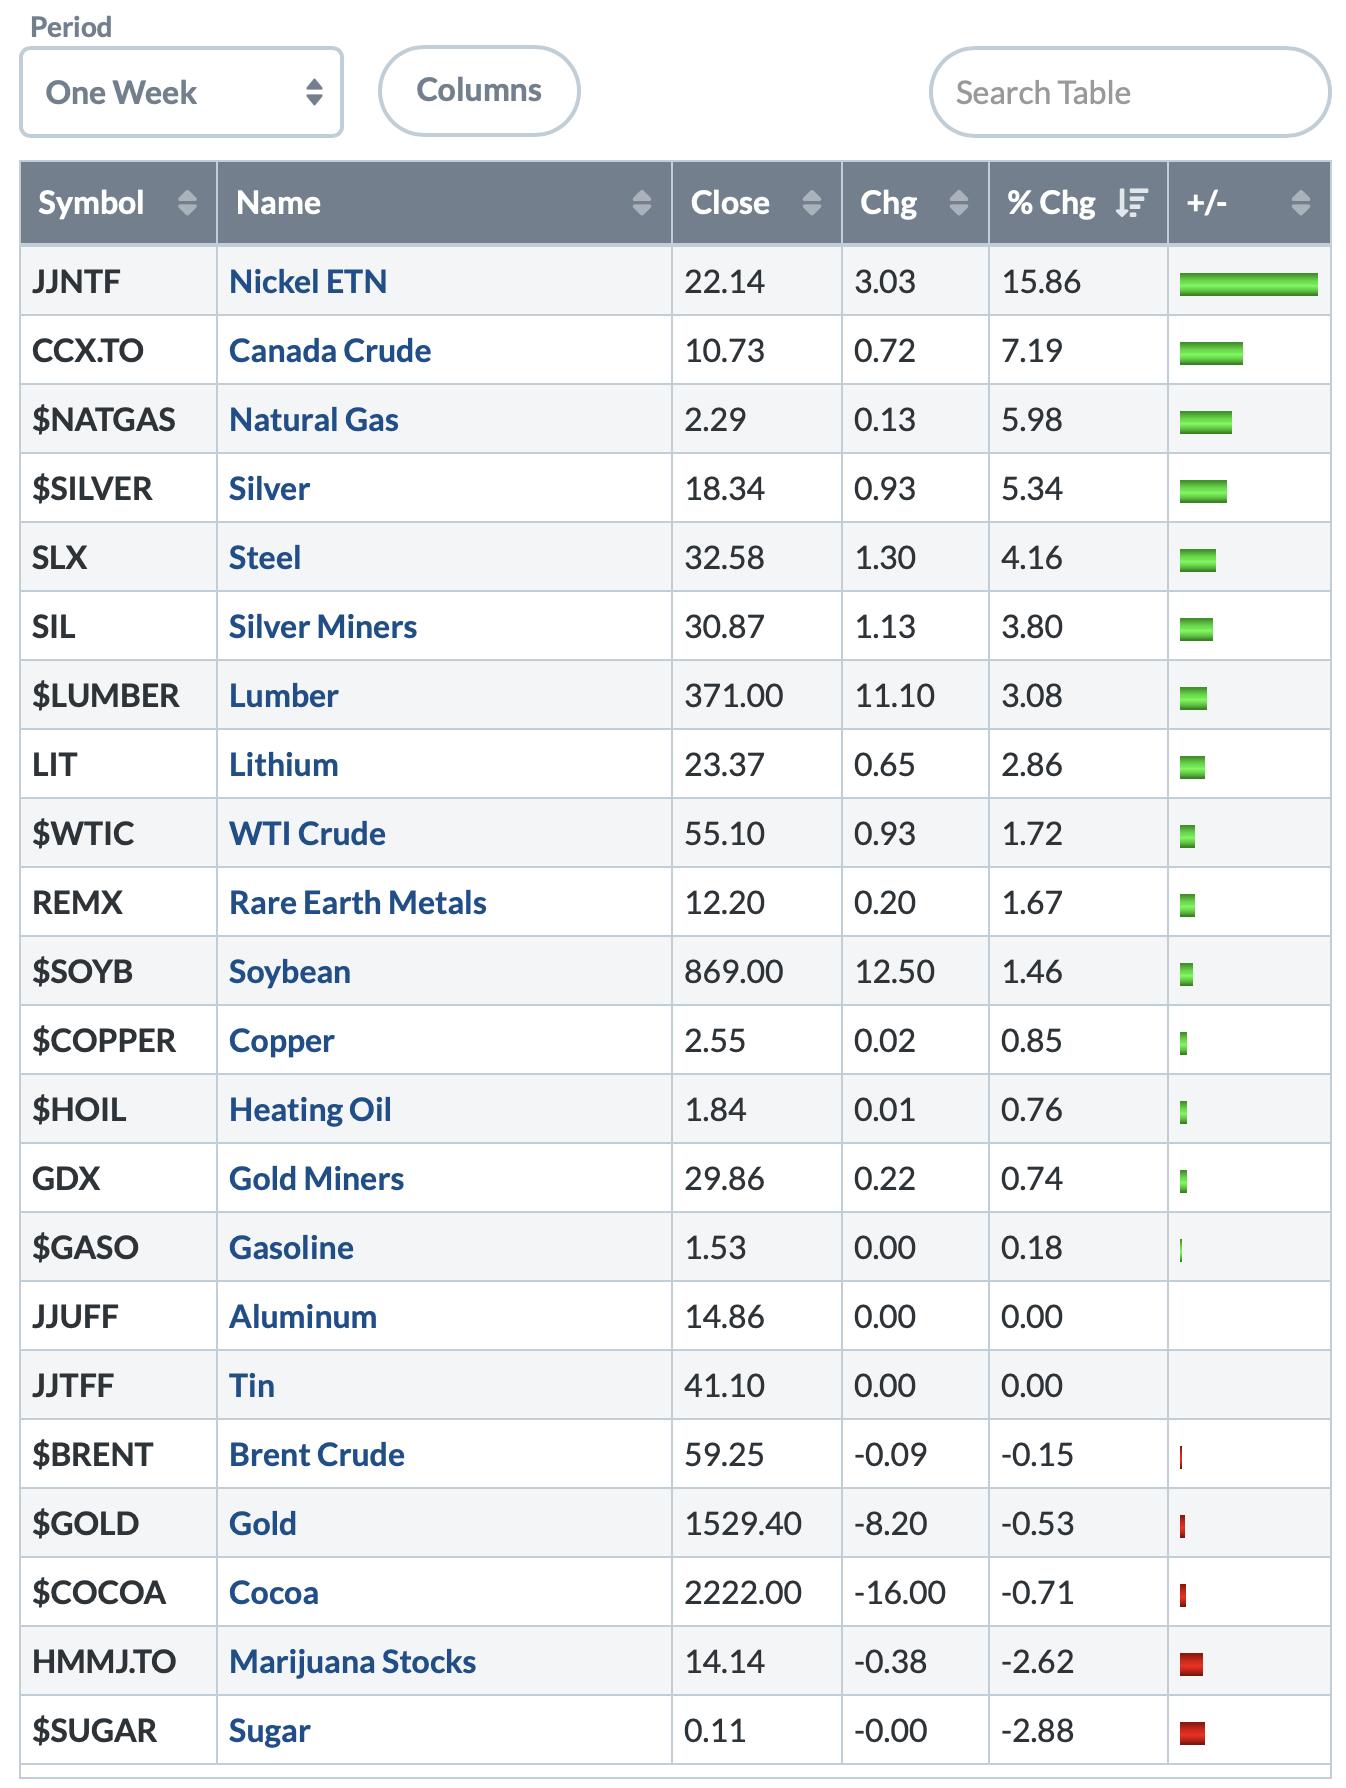
One caution to the optimism is that the big Dollar move happened on Friday, whereas the list above is a weekly. Note the Friday performance on the table below while the Dollar soared.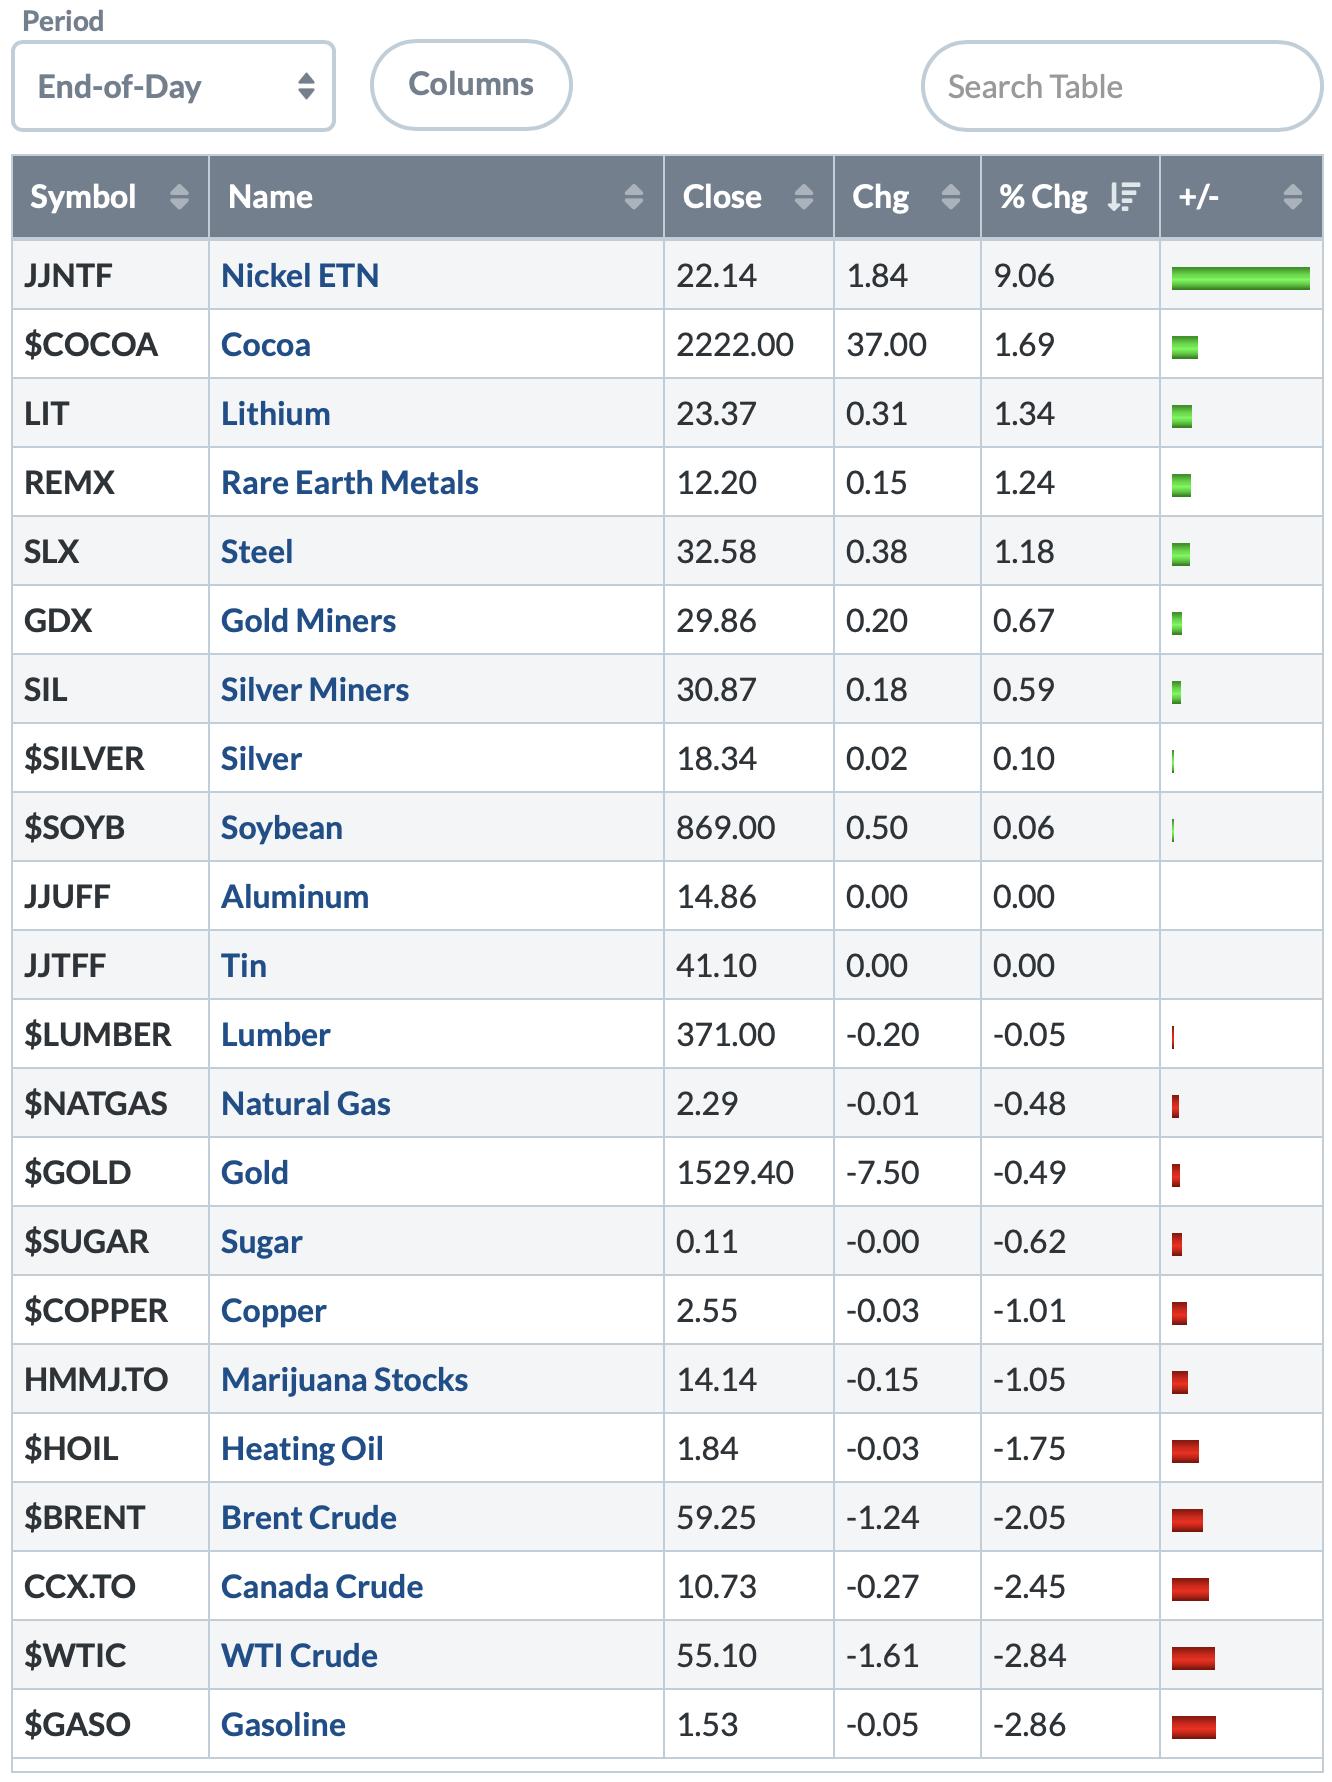
Having the Dollar at the top of the range up against the trend line is an important point of indecision. If the Dollar stalls at the trend line again, after having stalled there every time over the last year, that would set up a commodity rally. I mentioned this on the weekly video. If the dollar breaks out, can commodities continue to rally? The reason we have to ask that is that the commodities index ($CRB) is already at one of the lowest monthly closes in the last four years.
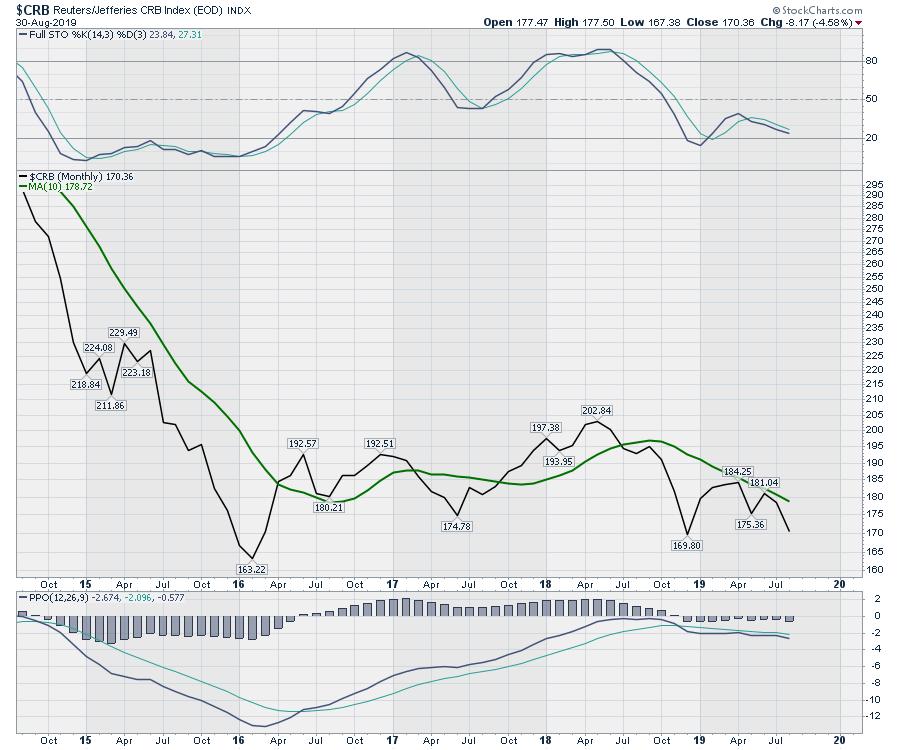
Are we about to get a change in tone, or do commodities need to plummet and implode? The latter is hard to imagine, as low commodity prices are already putting pressure on emerging market economies. Continued weakness for the emerging markets is going to place a lot more pressure on governments and citizens within those economies looking for work. That can't be good!
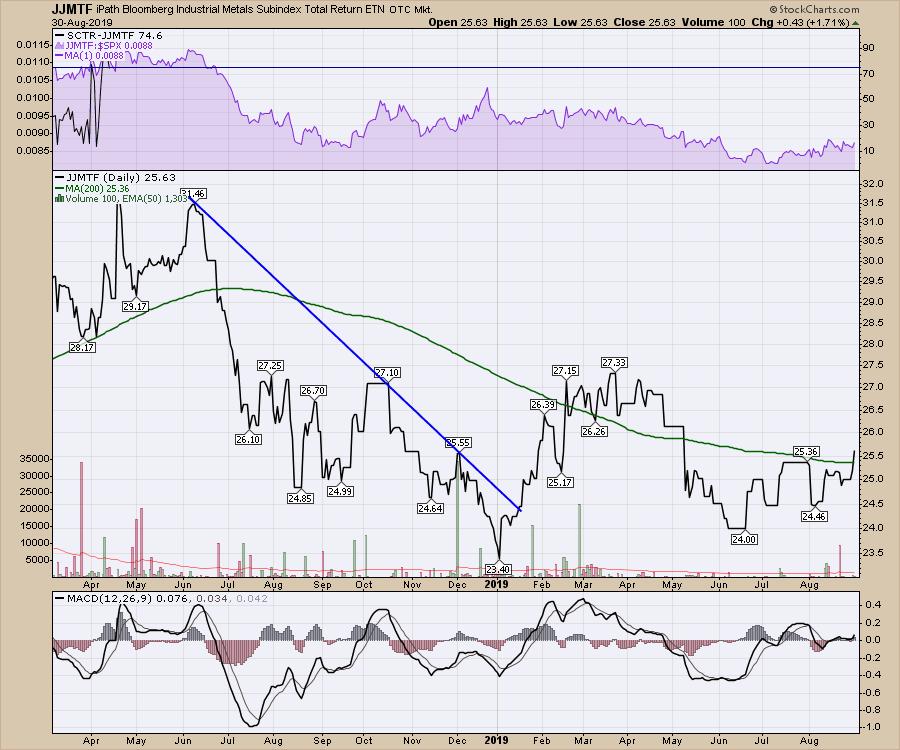
The price action of the oil stocks appears to be trying to bottom. Lumber-related names are climbing higher. Industrial metals actually crossed above the 200-day moving average for the first time in a long time. Nickel has been flying lately, and a big zinc mine owned by Teck has some problems that might take 3-6 months to fix (Teck -Zinc).
Here is an ETN tracking Industrial metals. The four metals are Copper, Aluminum, Zinc and Nickel, making this a mix of supply-side issues and nickel following the ramp in precious metals.
I don't have the answers for how this aligns with the US dollar surging and commodities improving. Will the trend continue? Well, that's why we review the charts every week. Here is this weekend review! Can you comment back to me with a note about the introduction and exit to the video this week? Send your feedback to the email address on the PowerPoint slide at the front of the video or comment on the YouTube channel! Just kicking it up with a little more personality!
Enjoy the long weekend! Stay engaged here as it looks like the market is going to rally higher, much to my surprise.
Good trading,
Greg Schnell, CMT, MFTA
Senior Technical Analyst, StockCharts.com
Author, Stock Charts For Dummies
Want to stay on top of the market's latest intermarket signals?
– Follow @SchnellInvestor on Twitter
– Connect with Greg on LinkedIn
– Subscribe to The Canadian Technician
– Email at info@gregschnell.com


