It seems incredible to say, but the market rallied 20% last week between the low and the high! What a great week! Once again, history gets in the way using facts to keep that in perspective. The 35% drop needs a 55% rise to get back to even.
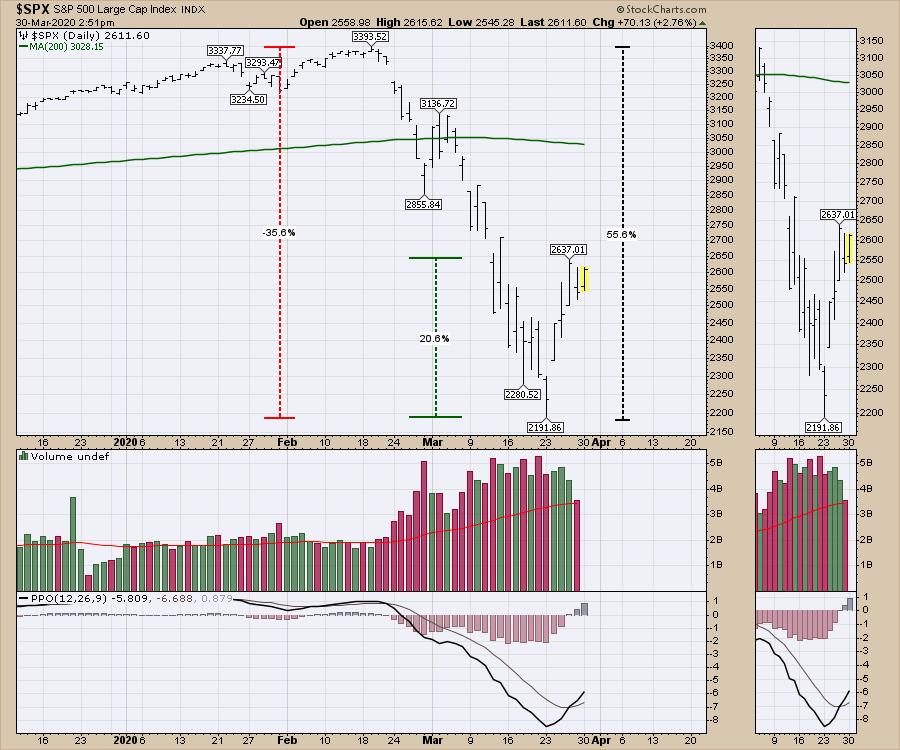
As unemployment soars and the Fed uses more tools than a finishing carpenter, it is a battle of the ages. The Fed is 4 for 4 in the use of QE.
I made a note on this 2015 Shanghai chart ($SSEC) that I thought was interesting. Check out the box in the centre. Even with global stimulus, the stock market topped in May 2015 and made a final low in January 2016. While there was no QE going on at that time, it had just ended in late 2014.
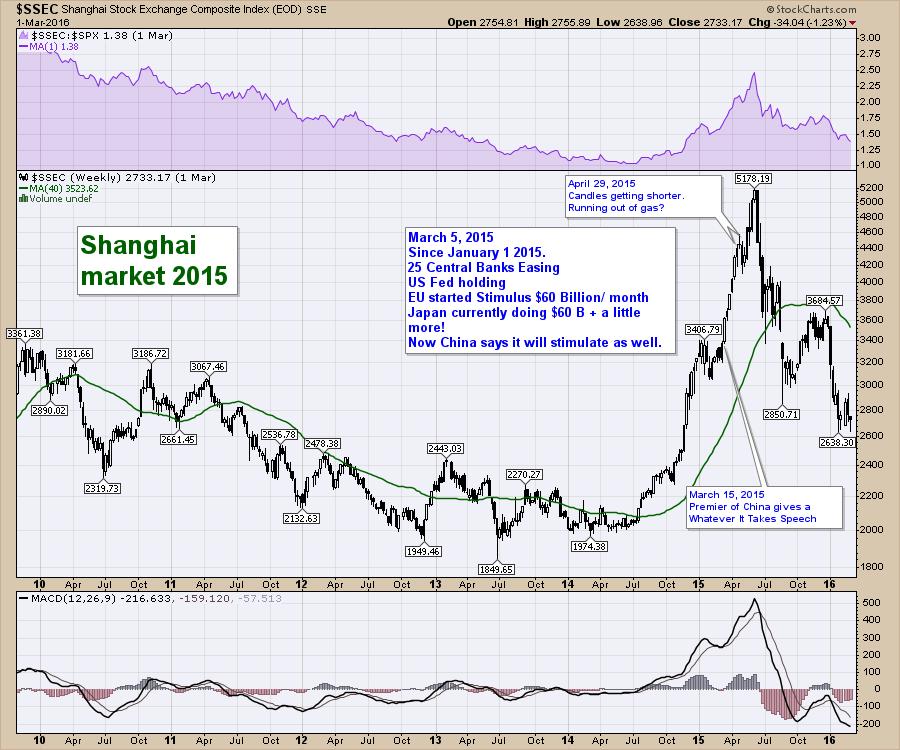
Here's the question - will QE be able to drive past all the economic problems coming at us to push the market higher? That is the crux of the problem. I have charts where my annotations say whenever the Fed is flooding the market with money, get long, real long. Ignore the world, buy the Fed.
As we sit in the face of soaring unemployment numbers, plummeting world trade and crushingly low PMI's being expected from around the world, the death toll is rising by the minute every day. Politicians worldwide are extending the periods of isolation, and the market is up 20% in a week.
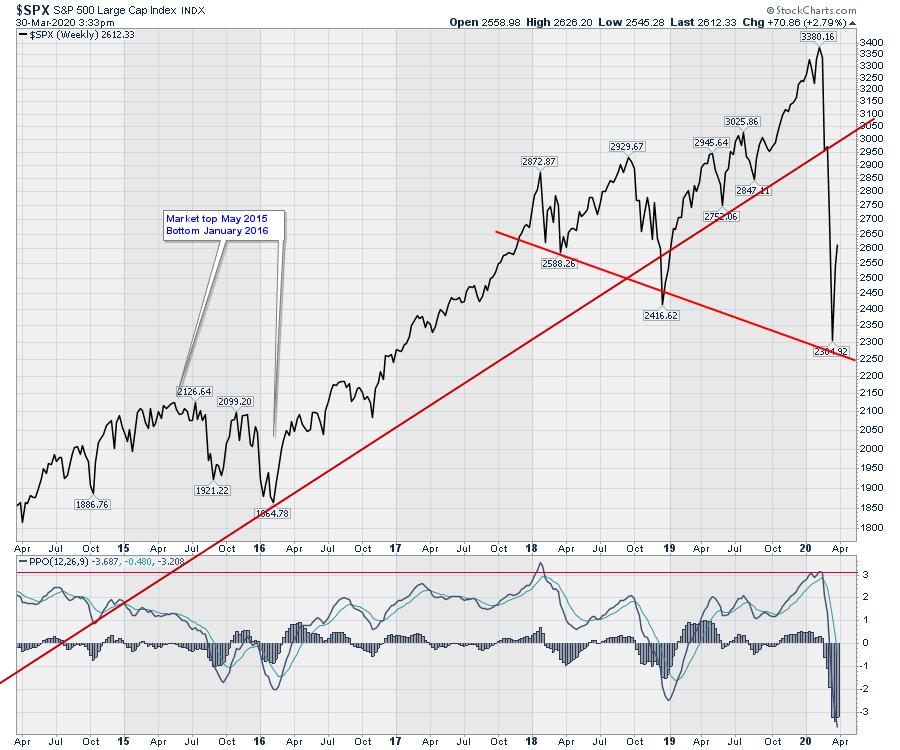
I look out, frozen in time, wondering if I should go back and buy the Fed because of ENORMOUS QE or realize that this time it is different. That is what makes investing hard. I have shown the US market on the chart below, which was the time period after the text box on the chart above.
I couldn't help but be angered hearing Barrack (from Colony Partners) that his rinse-and-repeat cash flow hedging program was no longer working in a down market, so the Fed should bail that out. I guess they should bail out everything that didn't keep a stock market price rising. Stay still, nobody gets hurt, we'll buy it all, go back to being all in. It's an amazing investment thesis.
Then you look back at 1929. The original drop was just phase one. The bounce was big, but then the selling was relentless. An article by a portfolio manager this week listed three things to suggest it was not 1929. I read the brief list:
- Money gets put in every two weeks by the buy and hold investing community.
- The Fed is more sophisticated now, using tools different than the old standard British ones.
- And one other. Oh yeah, we can't figure out what caused 1929.
Ok. Just go all in. The world spins better now.
Here is the 1929 chart from the StockCharts Historical Chart Gallery on the Charts and Tools Tab.
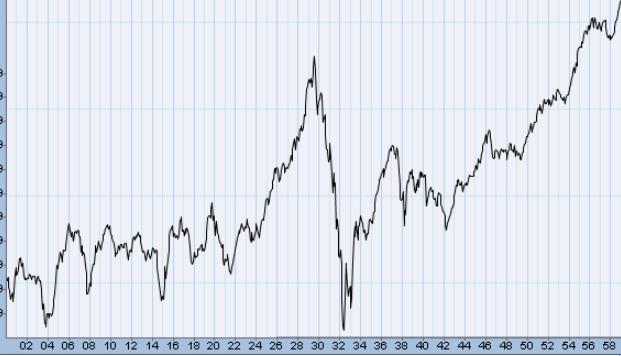
What could possibly go wrong that would cause a market drop of that scale in the modern world? Maybe nothing. But at least think about the reason it could continue. Human behaviour is a strange thing.
First of all, a rising tide lifts all boats. It is when the tide goes out or the seas get rough, that boats run into sand bars, old wrecks and rocks. The tide is out right now. Financial collapses don't happen at market tops, they happen midway down a correcting market. See Bear Stearns or Lehmann, Washington Mutual or Merrill Lynch.
The US bank ETFs corrected 50% from high to low. They corrected 50% more than the indexes' 35%. Ouch. Why are the banks correcting so much more? For a non-financial crisis, there is a lot of selling in the banks. Why has the Fed been easing since last fall? Why has the Fed been launching new policies like non-QE (repos) while the market was rising? What were the cracks that made that happen?
The Asian Financial Crisis wiped out Long Term Capital Management, with a room full of mathematicians suggesting it got outside of normal aberrations. As we saw the COVID-19 virus hit our shores from afar, we also have seen issues in the rest of the world follow us home. The PIIGS crisis in 2011 is an example.
I see a couple of obvious things overseas before we get to these local underlying problems in hedge funds getting their hedges hurt. If we are having problems in the USA, what are the odds of other funds in other parts of the world being struck down by the speed of the move? Let's list a few potential issues out so we won't use the phrase "black swan" if they pile on:
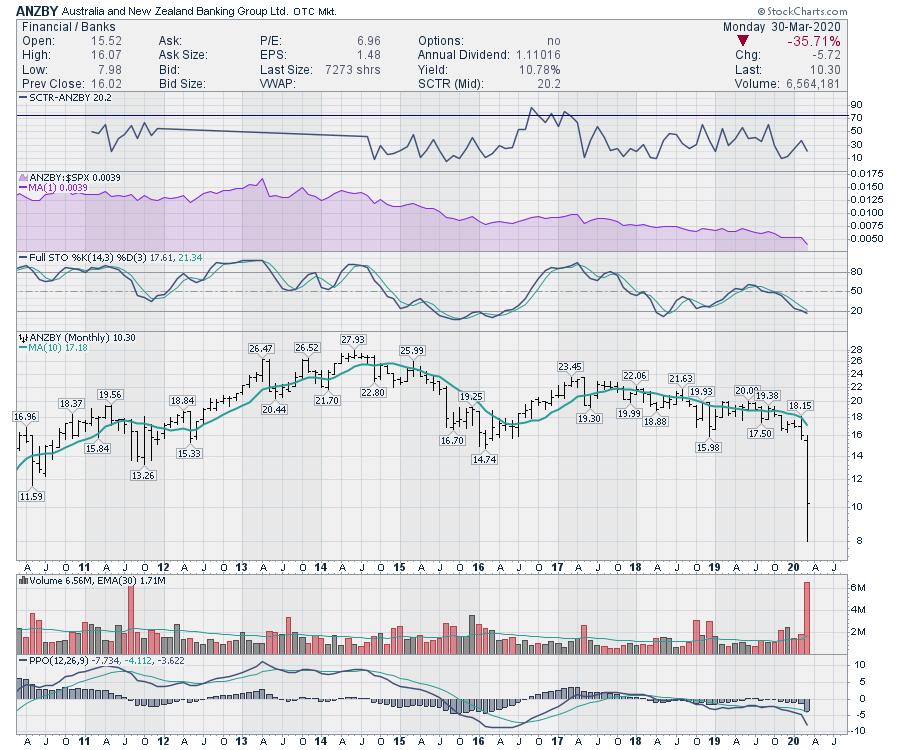
Australian banks have very high asset-to-loan ratios. I didn't know that information until recently, but they have some of the ugliest charts in my list of 80 international banks. Now I know why. Will they start to break down like US banks in 2008? 10-year lows. Its last major high was 2014. I have four Australia banking charts that all look weak.
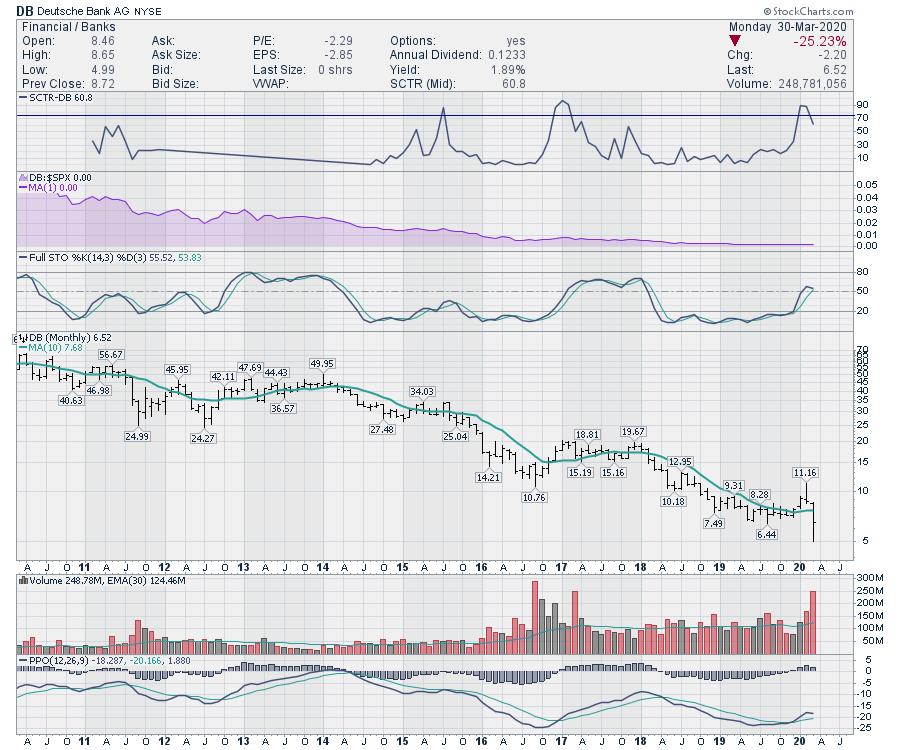
My understanding is that the larger European banks did not recapitalize after the Great Financial Crisis. I don't know about the fundamentals of each bank. I do know their bank charts look terrible, like something is very wrong.
When bank charts are terrible, that is a big problem. Other sectors can come or go, but bank failures are big. The European bank charts trade at very low prices typically associated with something like energy stocks in a beaten-down industry. Many of these bank stocks are sub-$10 stocks on their US listings, where a JPM is at $90. Check out the 10-year run for DB. Now add the COVID-19 situation.
Those are company-level problems. I could string 20 of those together in a story that becomes a black swan story if the tide stays out too long.
I could go on with country-level debt for Japan and Italy.
The bondholders started (for the 9th time) debt restructuring for Argentina at around 85% debt to GDP. Look at Japan.
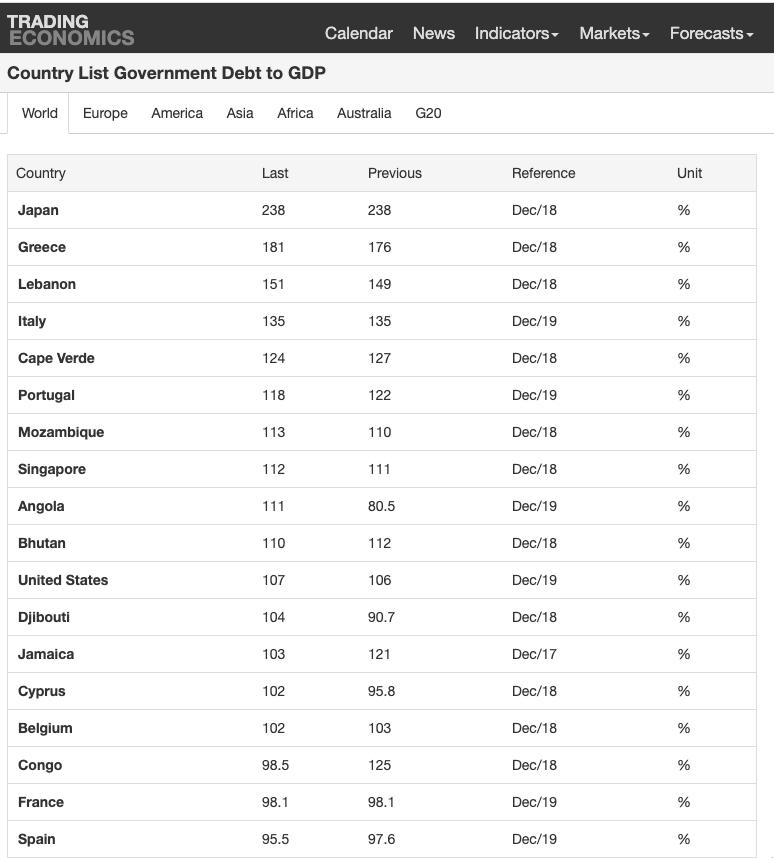
If GDP plummets and government spending soars, when do bondholders give up on the highest debt-to-GDP country in the world? At 300%, 400%, 500%? I know a lot of their debt is internally held, but what level does that finally trigger problems, with unemployment surging worldwide and trade problems due to tariffs that were on the radar before?
I get it. The Fed is pushing everyone to stay invested. If you'd like to go back up the truck and agree with those three reasons to stay invested, I get it. The problem is that the domino effects usually start to show up in stressful credit markets. Just be aware of the smouldering risks that were dormant in that rising tide. Now the tide is going out, with unemployment rapidly doubling around the world. At least by being aware of some of the most obvious situations, it's a lot better than saying we don't know why things blew up in a quick, melting market.
I just launched a new version of my website this week! It can be seen over on GregSchnell.ca. It will link with the gregschnell.com site later in the week. I am trying to build my subscription base, so if you are interested, you can use the code NETWORTH1 for a huge break on an annual subscription from $860 to $497. Click here to subscribe and be sure to check out the testimonials tab. Get it now!
Good trading,
Greg Schnell, CMT, MFTA
Senior Technical Analyst, StockCharts.com
Author, Stock Charts For Dummies
Want to stay on top of the market's latest intermarket signals?
– Follow @SchnellInvestor on Twitter
– Connect with Greg on LinkedIn
– Subscribe to The Canadian Technician
– Email at info@gregschnell.com


