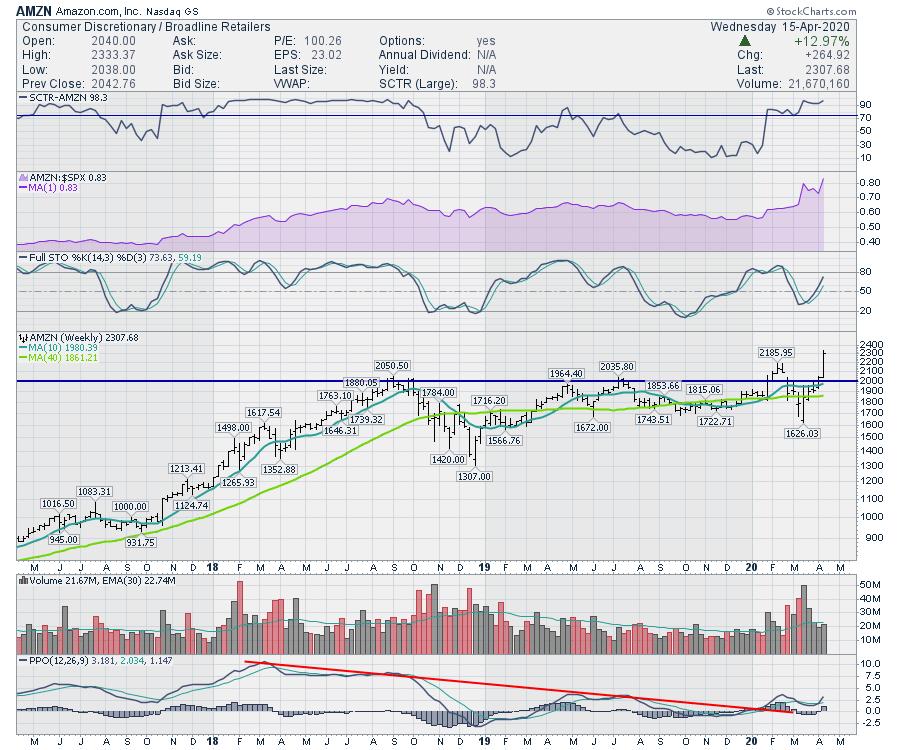
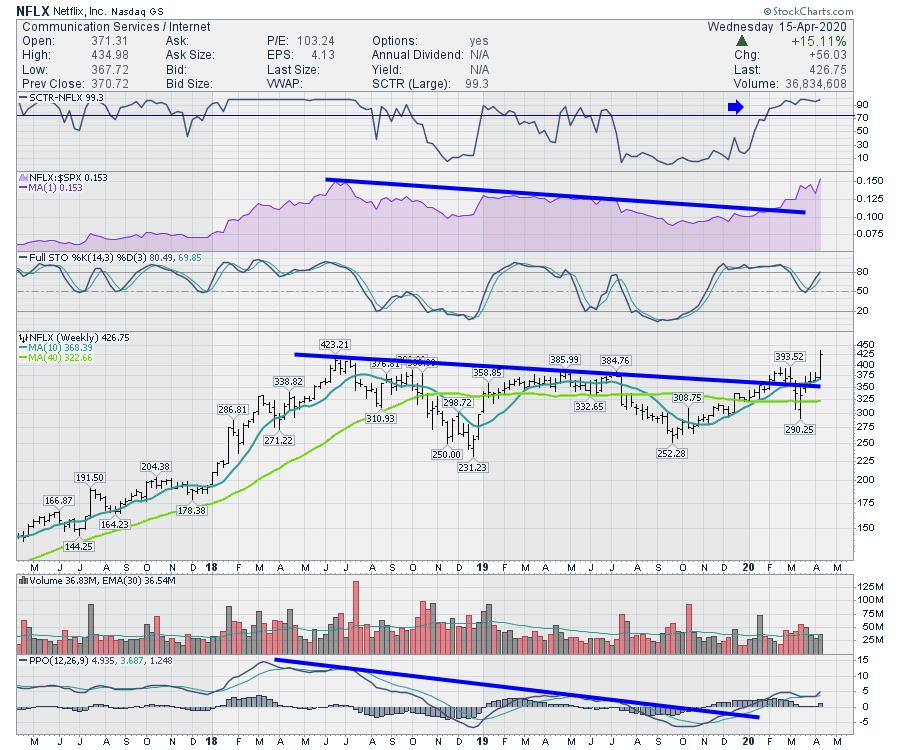
This week has already been remarkable with the leadership of Amazon (AMZN) and Netflix (NFLX). I think we can imagine that Amazon is becoming even more dominant with their reach and delivery systems. Netflix, meanwhile, has seen a huge jump in app downloads, and we probably all know some resistant friends that have joined the binge.
On this week's Market Buzz, I covered off some of the stocks that are already breaking out to new highs. One of the benefits of finding stocks already at new highs after a market correction is that all the owners are happy to own them and not really looking to sell, as the stock is a bright spot in their portfolio.
The chart of Netflix is just as appealing.
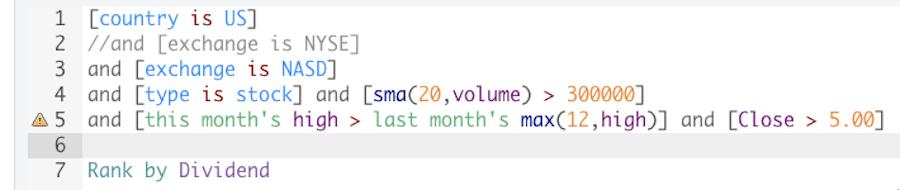
This simple scan can help find big winners as they break out to new highs. In the example below, it looks for new highs on the Nasdaq, but can be altered to look for new highs on the NYSE as well.
Both of the charts also have technical traits that we can scan for that work well after a big pullback or from a bear market. So will the same scan work to find soaring names like Tesla (TSLA)? It has been a big stock and on fire of late, but it has not made new highs. Can we find other similarities using the indicators, rather than just the price?
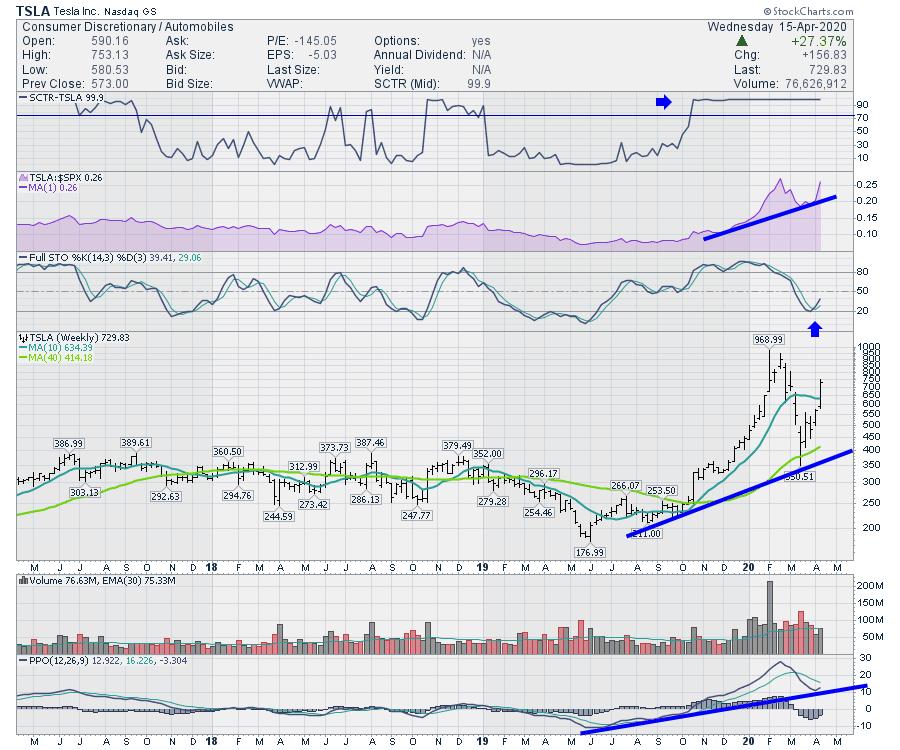
There are a few common elements in the indicators that are not the same on the price component. All of the stocks have a strong SCTR ranking above 75. During the correction, the weekly PPO stayed above the previous low and, because this pullback was so brief, all of the stocks also have a PPO that stayed above zero. The full stochastics are also all turning up now. This week has obviously been a breakout for these three stocks. We can also use variations and different settings of these technical clues to help find strong stocks breaking out. While the price on AMZN made a lower low, the price action on the other two stocks did not.
These stocks are just starting to break out. If this rally can continue, we'll see more technical breakouts. Using some of the scans and tools on StockCharts, we can make these stocks a lot easier to find.
Hopefully, the scan above can help get you started on scanning. As the charts change, we'll be able to find new strong breakouts as they occur by using these tools. I'll continue to provide other methods to find strong stocks. We still have volatility ahead, but using technical tools, we will be able to use different methods to navigate through the earnings storms on the horizon.
Good trading,
Greg Schnell, CMT, MFTA
Senior Technical Analyst, StockCharts.com
Author, Stock Charts For Dummies
Want to stay on top of the market's latest intermarket signals?
– Follow @SchnellInvestor on Twitter
– Connect with Greg on LinkedIn
– Subscribe to The Canadian Technician
– Email at info@gregschnell.com


