US banks took a bit of a hit Monday, as we saw some meaningful selling on high volume. The charts for some of the North American bank industry are holding up, but other banks around the world are barely holding above the lows. One of the magic messages for investors is that we can see what the other investors are thinking about banking companies as the pandemic takes on the world.
So I'll walk through the charts through Europe and then the USA, and you can decide where you think the problems lie. These companies are also traded in the US, so we have a consistent currency.
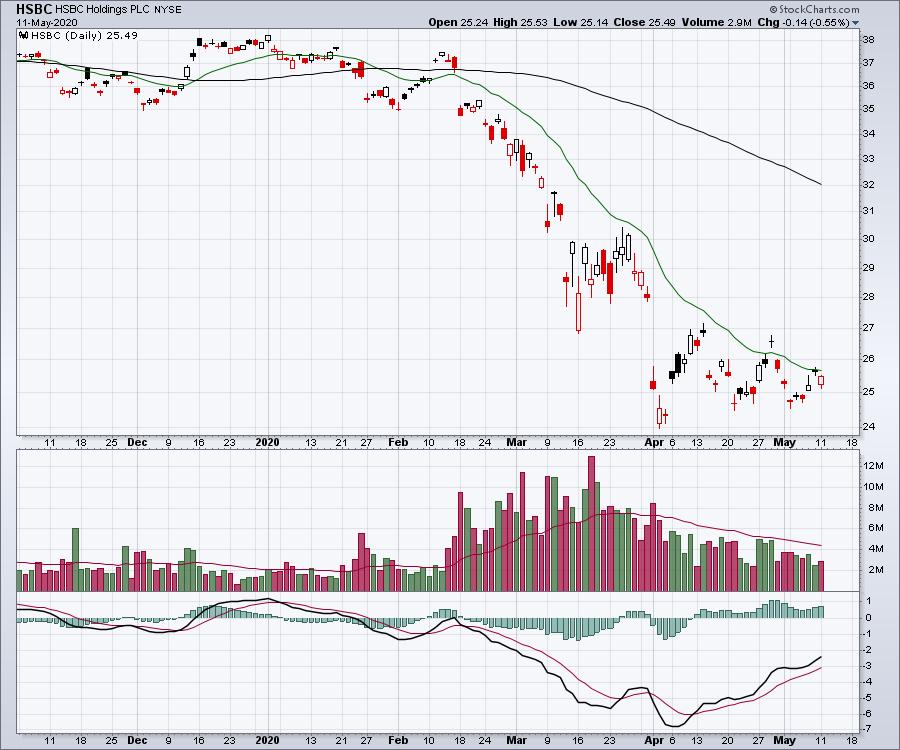
Let's start in London, England with HSBC (HSBC), headquartered on Canary Wharf. This chart made its low April 2nd, which was a full 10 days after the $SPX made its low. The chart tested the prior low recently on May 1, getting within $1 of the lows.
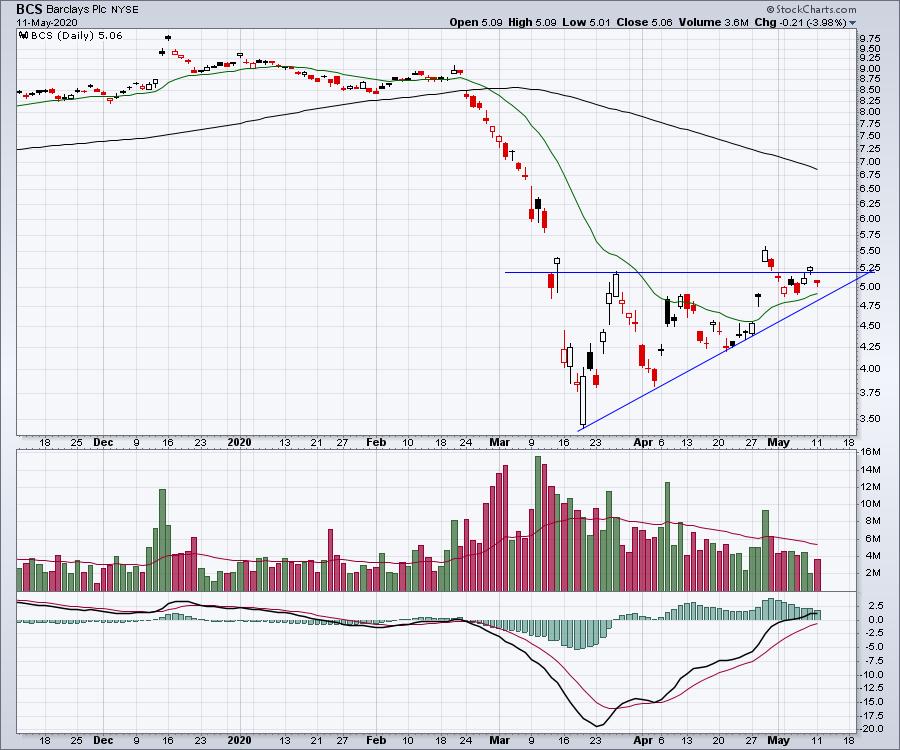
Continuing on, Barclays (BCS) is also in London. Barclays' chart looks a lot stronger than the HSBC chart above. BCS bounced before the $SPX bounced, which is usually a sign of some strength. One of the other concerns on this chart is just the actual low price of the stock. A major world bank down at $3.50 isn't exactly a tower of power. But this back has rallied a full 50% off the lows, which is more than the $SPX at 35%. This Barclays chart also has a PPO above zero, which is a hint that there is more momentum in this name than the other British banks.
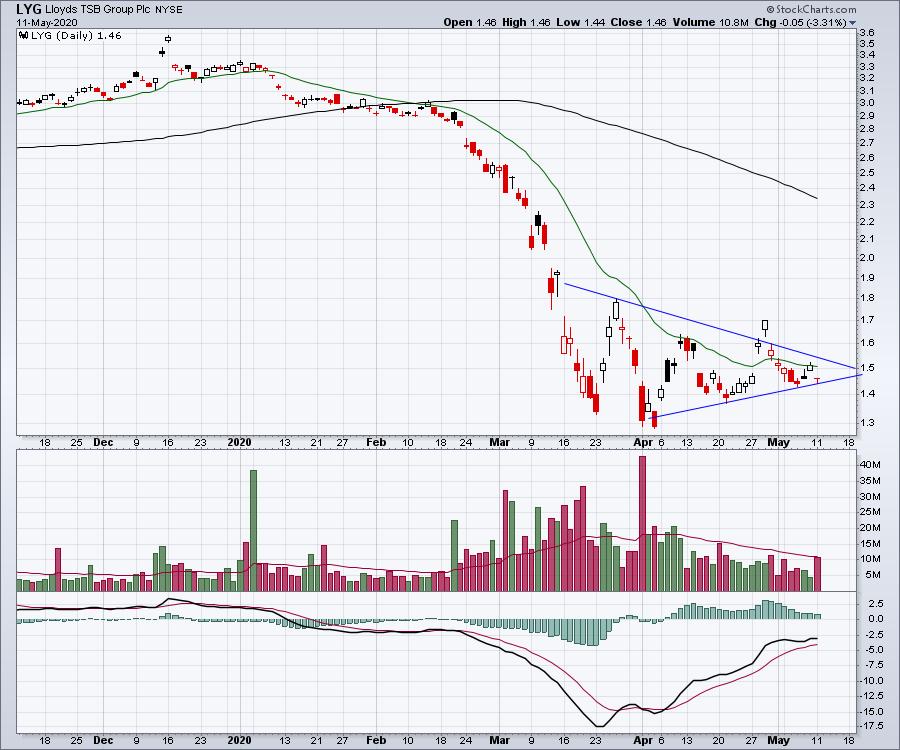
Lloyds (LYG) of London is a world-famous brand with a stock trading barely above a $1.00. Almost miraculous. This stock also bottomed later on April 3rd. As it is trending a little higher, it is not exactly the resilient bounce we would like to see. The trend line needs to hold here, but it is so close to the lows that we will probably see a test of them on this chart before summer.
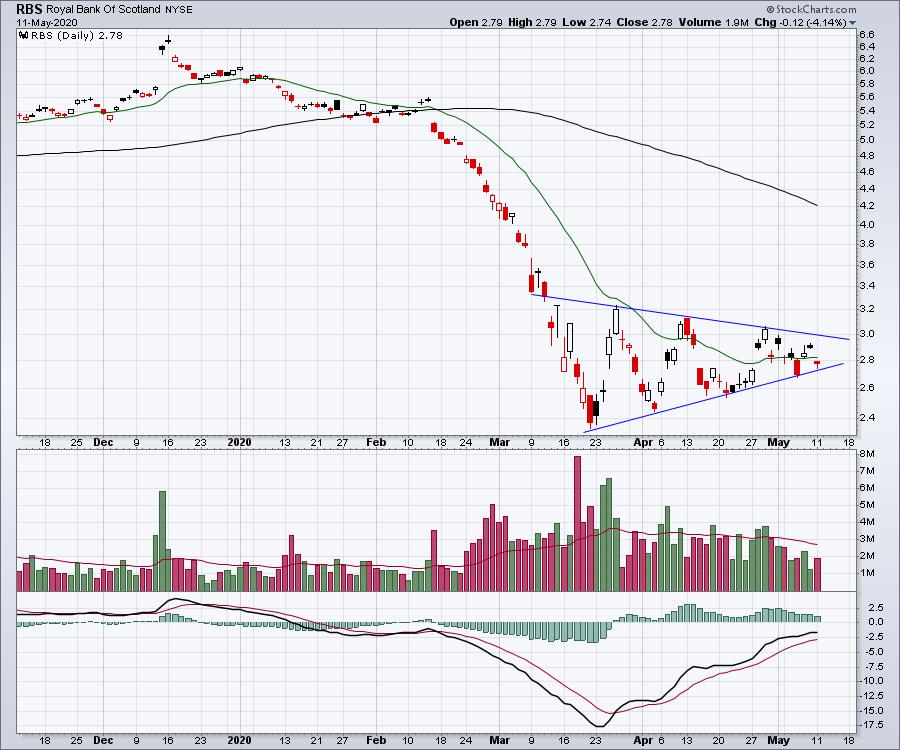
The last of the UK banks is Royal Bank of Scotland (RBS). This stock bounced with the $SPX on the 23rd and it is above the 20-day moving average. Not a huge compliment, but it is not the worst of the pack. The pennant is well-formed. The question is: is it a continuation pennant or a reversal to start the move higher?
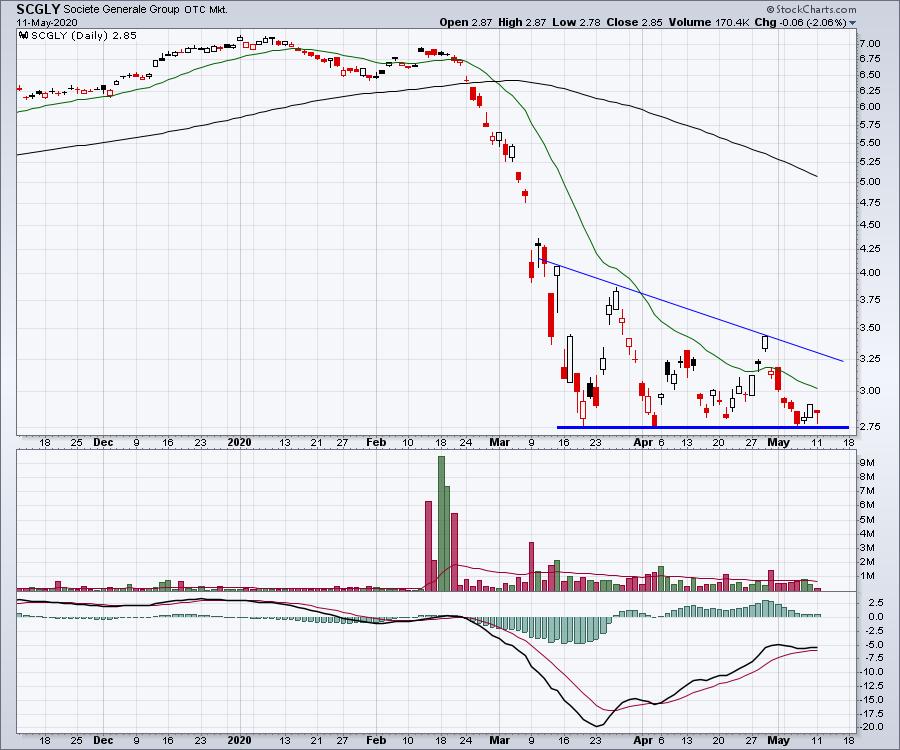
Rolling into France through the Chunnel, we find three banks. First is Society Generale (SCGLY). The problems on this chart are numerous. The chart has a $2 price handle, which suggests weakness compared to J.P. Morgan (JPM) over $90. As a relative measure, that low price demonstrates weakness. This chart dropped 60% off the highs and tested the lows as recently as Monday. Descending triangles usually continue to test the base and finally fall through. I would expect that this chart does not hold up if the markets were to make another roll over as we head into the 2nd half of a weak 2nd quarter. It looks pretty shaky.
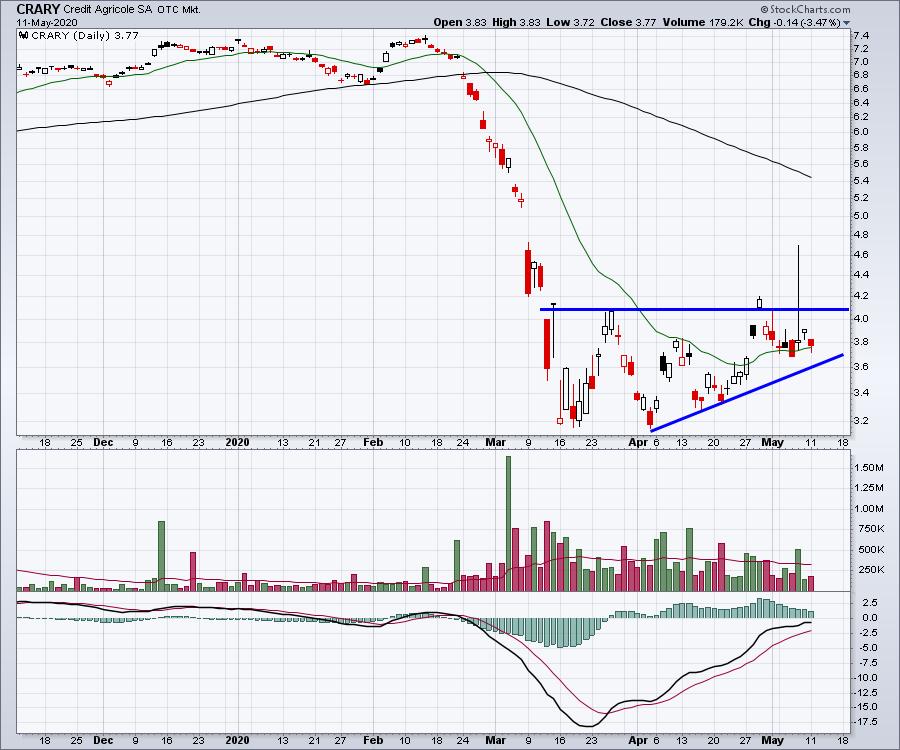
Credit Agricole (CRARY) looks significantly better than Societe Generale's price action. At least there is a series of rising lows. I placed a horizontal top line as both moves above it were immediately reversed. Price closed at the 20-day moving average but was down again on a flat day for the $SPX. This continual underperformance does not give me hope.
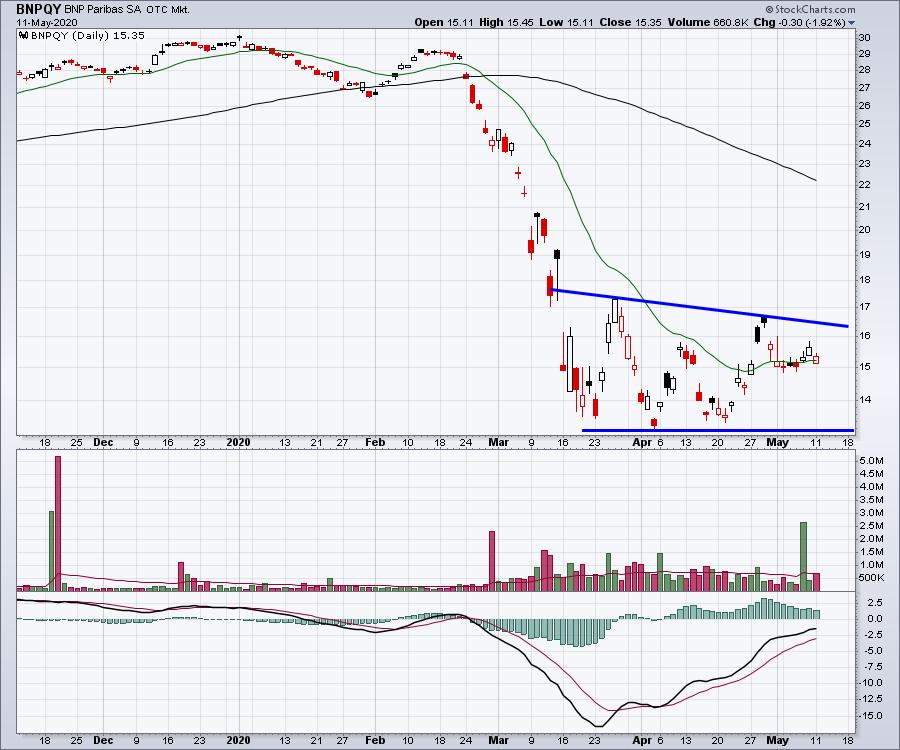
BNP Paribas (BNPQY) rounds out the French banks. All three of these banks have a weak PPO indicator that has not made it above zero, but BNP looks average compared to the other two. Price closed at the 20-DMA, but it does have a series of higher lows over the last three weeks.
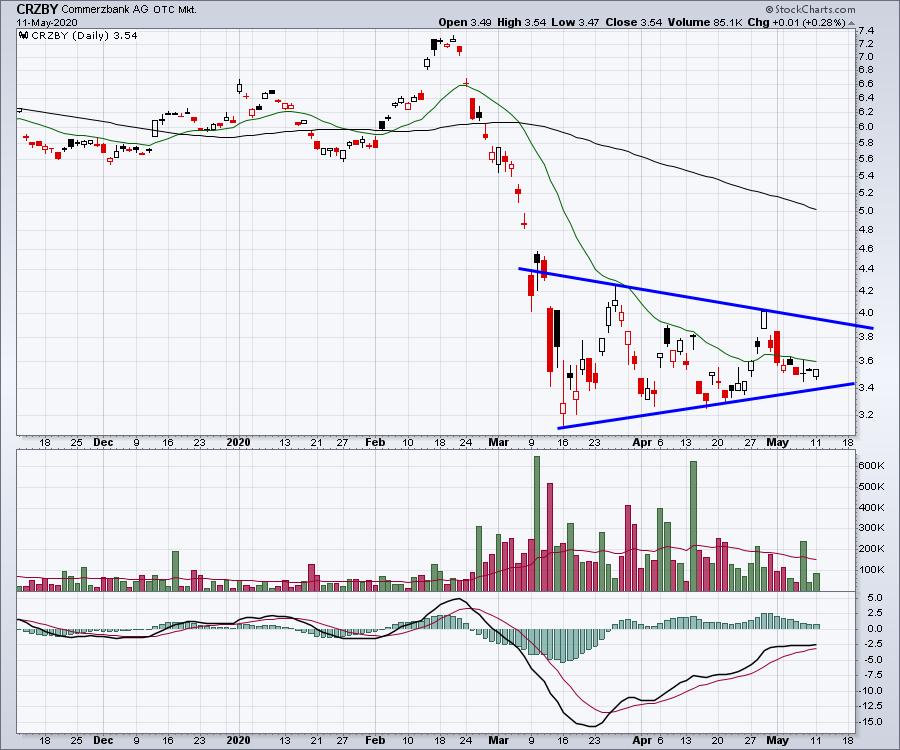
Moving on to Germany, Commerzbank (CRZBY) is spending more time near the bottom of the pennant than the top, but it does have a series of rising lows and it did make its low a full week before the $SPX.
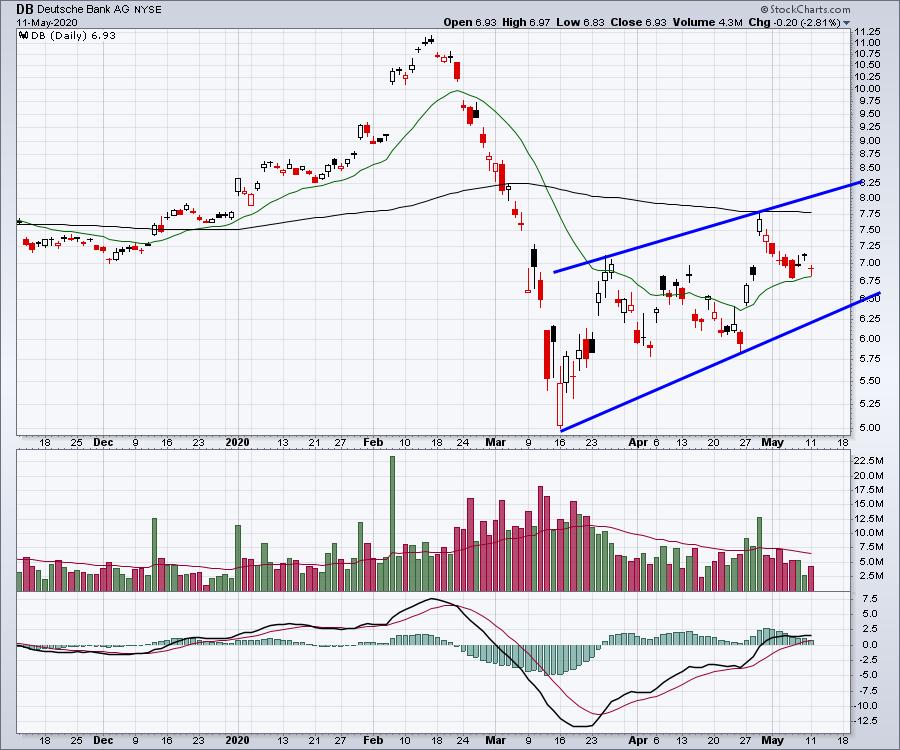
Deutsche Bank (DB) is one that we hear a lot about because of its derivative book. Of all the charts so far, this one has a defined uptrend, bounced earlier on Monday March 16th, and has actually created a channel of higher lows and higher highs. The PPO momentum is now above zero, and this chart is a pleasant surprise. The stock fell 60%, so it will need a rally of 125% to get back to its highs. At this point, it is up 40% off the lows.
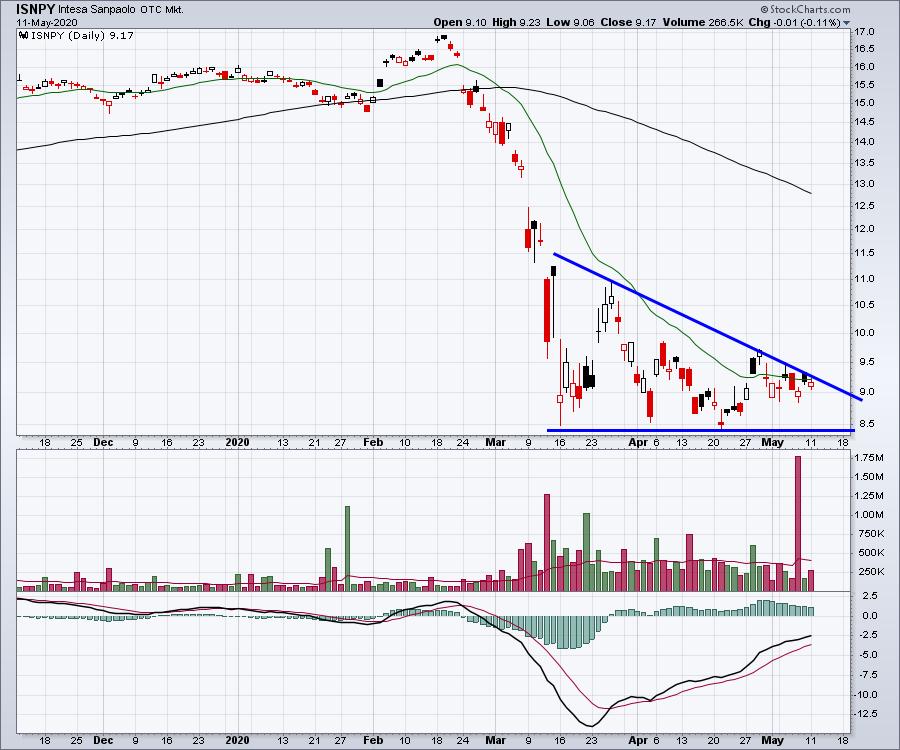
Let's take a quick look at Italy. Intesa Sanpaolo (ISNPY) made a low on April 21, which is the lowest low on the chart. While the price is hovering around the 20-DMA green line, so far the trend looks pretty weak. The positive observation is that it has not tested its April lows in May yet.
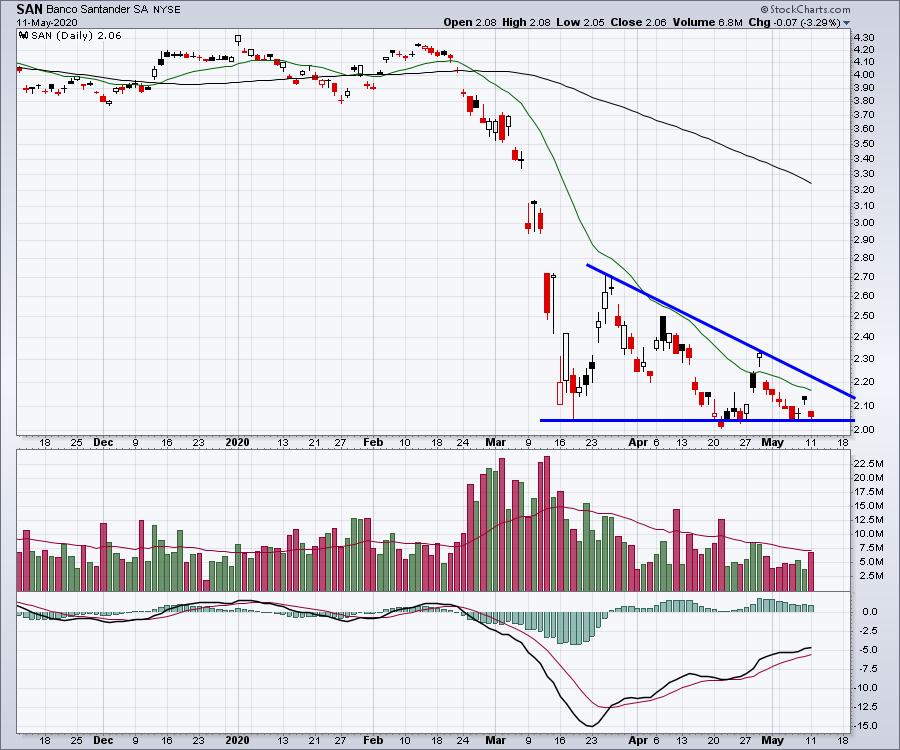
Banco Santander (SAN) out of Spain is one of the weakest charts we have seen. First of all, the $2 price tag is a clue, but the chart keeps pushing the lower boundary as recently as Monday. The stock is still below the 20-DMA and looks weak.
So a quick trip around Europe, without the need for a massive review of a lot of the financial statements, give us a clue to which companies and countries are weak.
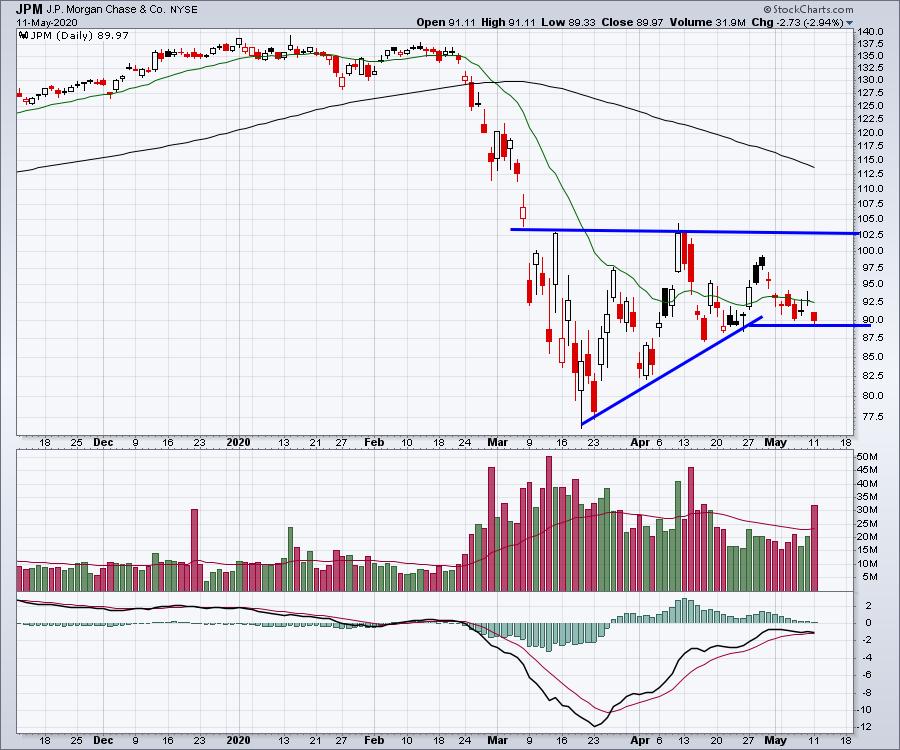
Obviously, JPM is the big stable force in American banking. But the chart Monday, with soaring volume on a large down day (2.9%) after breaking the uptrend, looks more difficult. The $SPX was flat on the day. As the big leader, that chart is not as bad as the charts above, but the volume and the broken uptrend start to add concern that the stock might not be able to stay above the one month lows. It's an important time to watch.
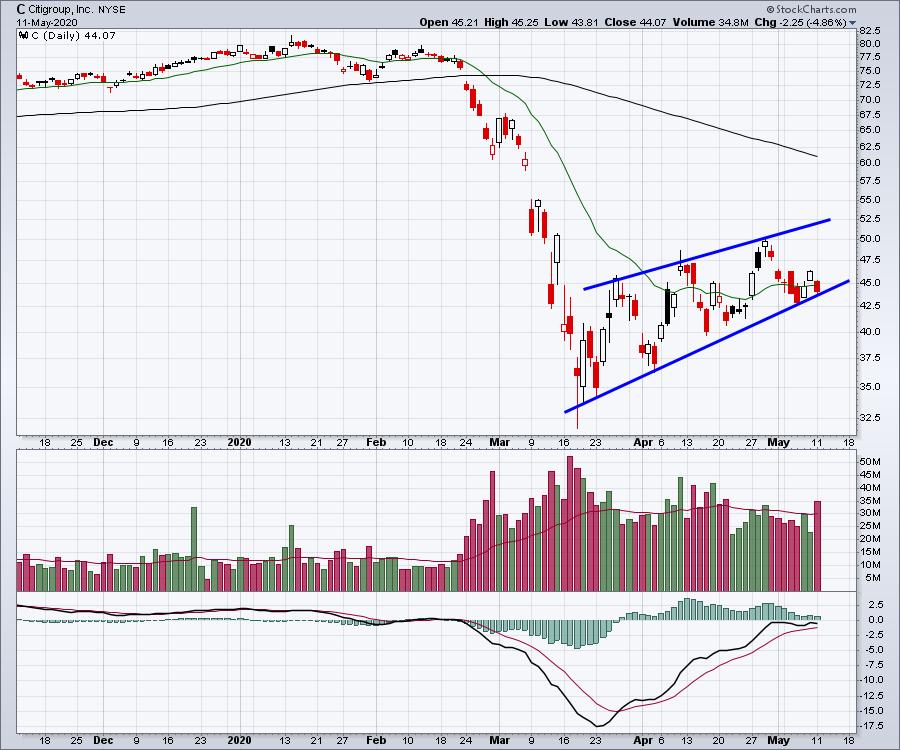
Citi (C) had a horrific fall off the top. It was one of the banks that dropped the most; $82 to $32 is a long road down and an even bigger road back. While Citi is trending higher, it also had extreme volume on a flat day for the $SPX and the stock was down 5%. Ouch.
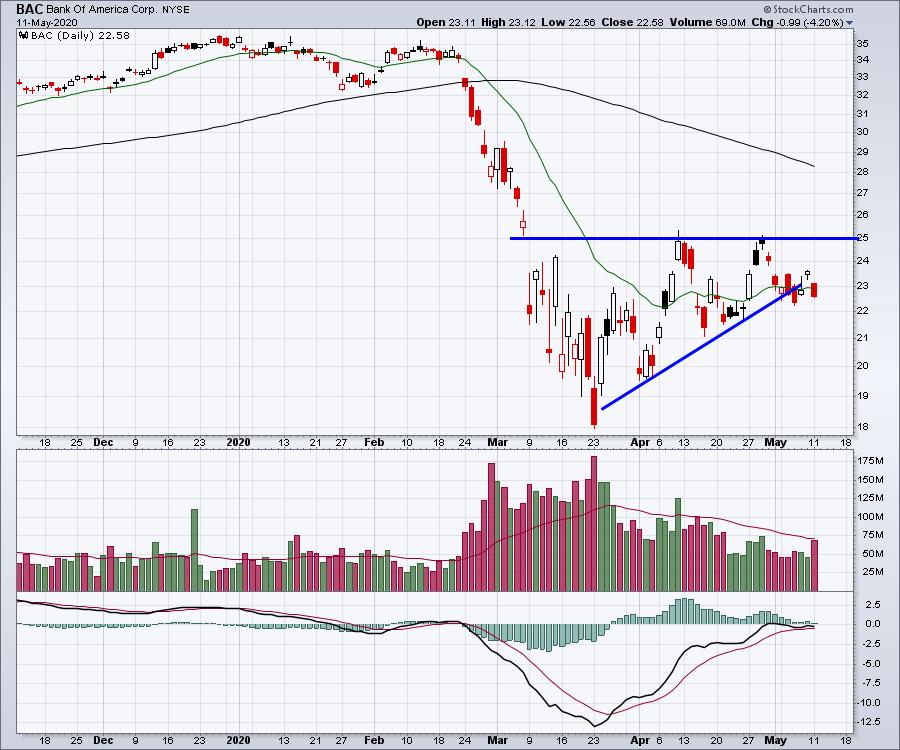
Bank of America (BAC) dropped in 1/2 from the top of the chart. The horizontal PPO indicator in the lower panel suggests momentum is waning at zero. Like JPM, the stock is breaking the uptrend now and is stalling around the 20-DMA. This is the second down candle in a few days below the uptrend, suggesting the market is doubting the uptrend. The fact that JPM is breaking the uptrend as well adds to the concern.
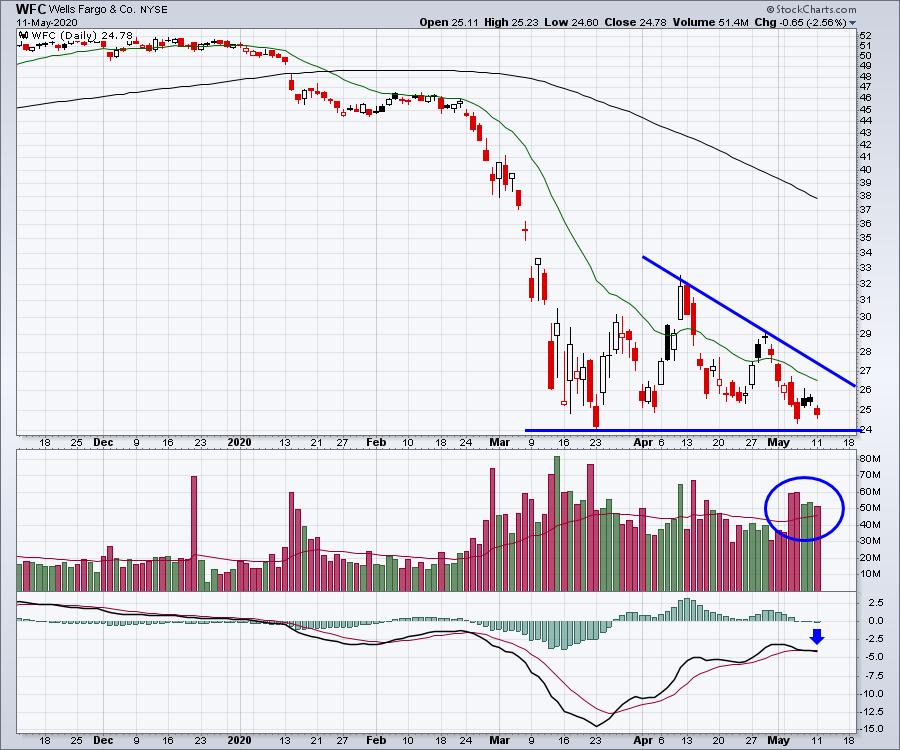
Wells Fargo (WFC) is a mess, actually. The chart continues to test the lows and the volume is piling up, suggesting more concerns here.
By reviewing the European vs. American banks, we can quickly see where the hotspots are in the banking sector. The banks around the world that are struggling to hold their current lows look worrisome. Having the stronger US banks start to break the uptrends is not comforting either. I think the real dilemma here is the number of European banks that are testing the lows. If you want to go check these banks out in the future, you can click on the charts and they will update.
All that to say, the week I really wanted to see the banks turn higher, the US banks are starting to slip. While they are clearly not the weakest, the European situation has numerous banks sitting near their lows. Conversely, if it was just a weak Monday and we march through the week with strength, that broadening trend of financials starting to respond to all the stimulus would be welcome news.
Don't lose sight of this article, as the banks could be a signal for the market to start moving higher if they can find support. It would be nice if they start accelerating here. If they don't, stay aware of the other industry groups that are starting to weaken. If you want to go check these banks out in the future, you can click on the charts and they will update.
Good trading,
Greg Schnell, CMT, MFTA
Senior Technical Analyst, StockCharts.com
Author, Stock Charts For Dummies
Want to stay on top of the market's latest intermarket signals?
– Follow @SchnellInvestor on Twitter
– Connect with Greg on LinkedIn
– Subscribe to The Canadian Technician
– Email at info@gregschnell.com


