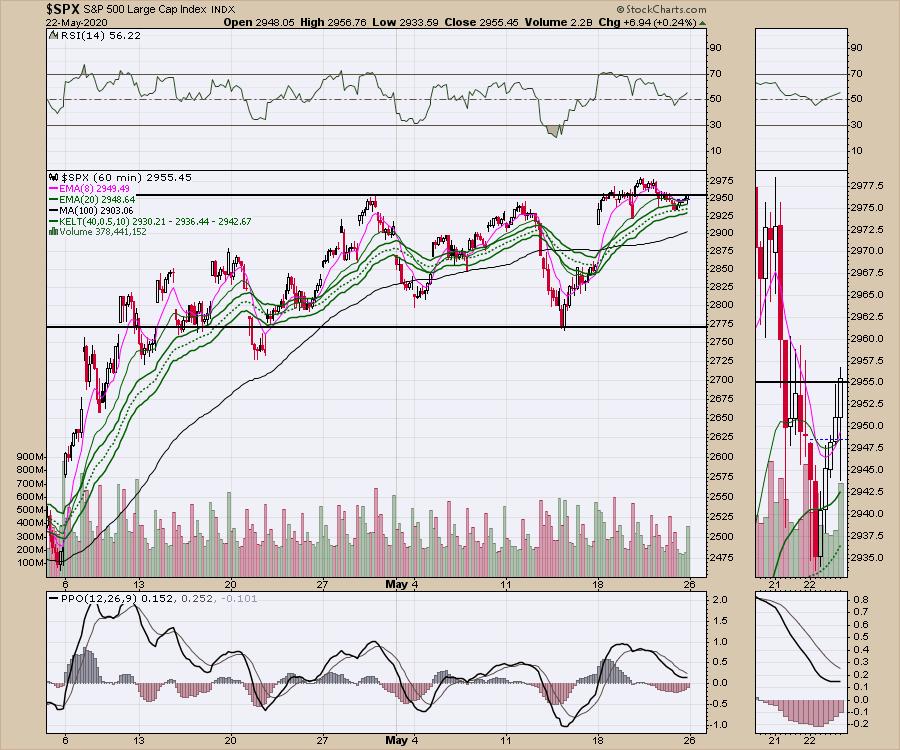
The market has been trapped in a sideways area for the last 7 weeks. Since April 6th, the market has worked a range between 2750 and 2950. This week, it tried to break out topside and ended up closing back near the top end of the range. Below is a 1-hour chart of $SPX showing the breakout:
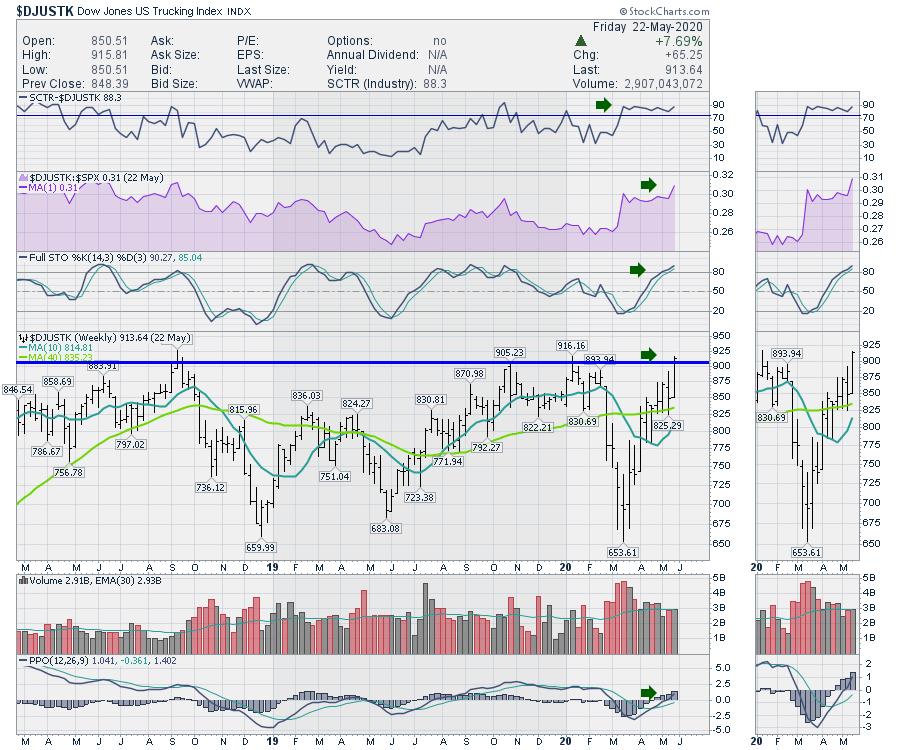
There were lots of stocks breaking out from bases or to new all-time highs this week. After last week's threat of weakness, this surge is nice. It looks like the transports are joining the move as well. The trucking index ($DJUSTK) closed at the highest weekly level in years. The line is at the highest prior close; it has stalled at this level 3 times before. If it can't continue, this is an important place to watch for another rejection. It would probably clue us in to mark a top that suggests the economy is too weak to support higher levels for the truckers. Get some popcorn - we are nearing the dramatic climax where we'll see if the uptrend starts to break out and hold above this consolidation.
Seeing the transports break out is very promising. For moving large quantities of industrial goods, the railways ($DJUSRR) should also break out. While they are not as advanced in price as the truckers, there are some very promising signs. This week should be conclusive regarding whether the rails are going to start to outperform the $SPX, which would be something associated with a new uptrend. From my work, I have noticed that, during bigger advances, the rails also start to outperform the $SPX. This shows up on the chart below, with the purple area breaking the downtrend line and continuing to move in an uptrend. That started to happen last week, so this is an important place to watch. You can click on the chart to check on it in the future.
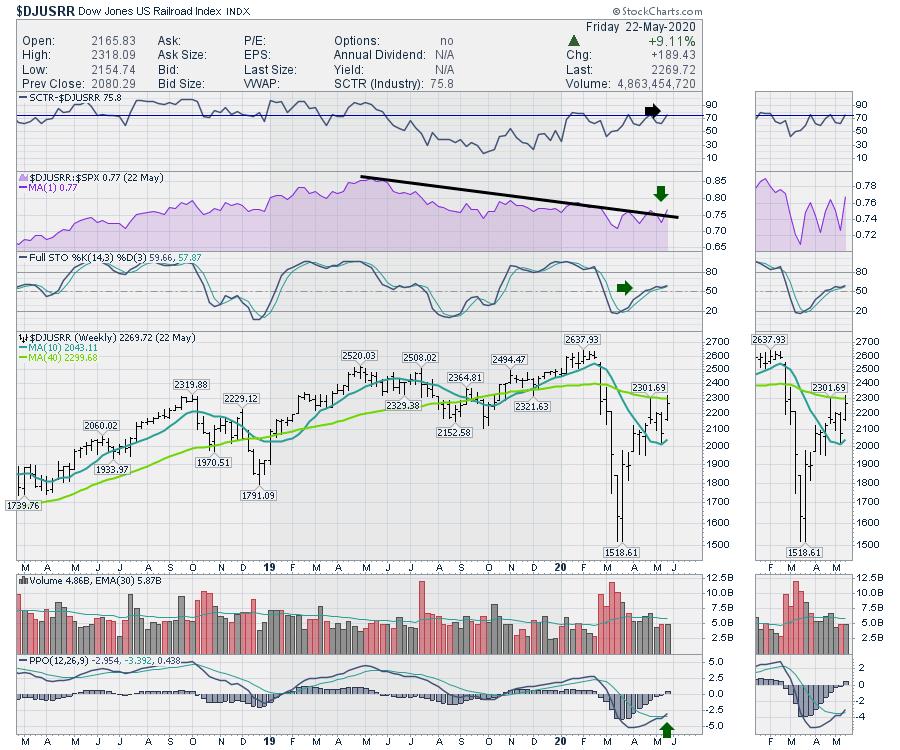
There are a few other important clues this week on the railway chart above. The PPO momentum indicator gave us a positive crossing signal. If the full stochastic can start to accelerate higher, that would be good. Bear market rallies usually find the full stochastic fails near the 50% level, so a break above that is helpful. (Now would be good!)
Price is also trapped under the 40-week moving average. On the left side, it was support for most of the time on the way up. We do not want it to become the resistance layer now.
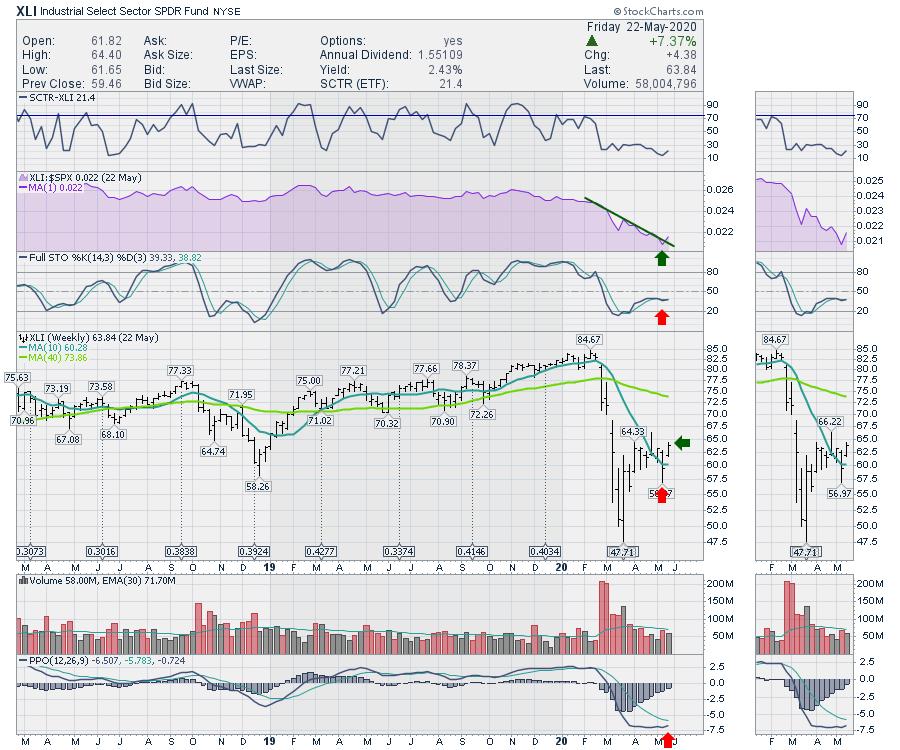
The industrials (XLI) have had a stormy few weeks. It looked like they were set to break out, only to fail two weeks ago as they closed below the 10-week moving average and the chart looked very weak. Then, this week, they rallied past the 10-week and broke the downtrend on the relative strength compared to the $SPX. The chart still needs to improve a lot more, but if this rally is going to broaden out to more than the tech and biotech areas, the industrials should start kicking it up.
If the SCTR ranking could start to surge above 30, that would be another clue the weakness was fading and the broader markets were going to be supported by these major employers. The full stochastic is still very weak at 40%, so that needs a good swift kick to mobilize it. This stochastic will move up if the price starts moving up aggressively, compared to the price range over the last 14 weeks. Because the price is so low and nowhere near the top half of that range, the stochastic has remained below the 50% level. With big companies like Boeing (BA) and General Electric (GE) holding the industry back, it is easy to understand the issues. The question now is can it turn and help the rally?
So it is early days for the industrials, but the transports are starting to signal that things are better. In order for the Charles Dow confirmation, both of these chart types (transports and industrials) need to move higher together.
We all know that tech has been the rallying area of the market. But, eventually, even regular buyers start to wonder about the significant weakness in the rest of the market. I am looking for these other groups to start accelerating. Energy continues to work higher and the banks still have a bad hangover. None of the bank charts are particularly exciting. If they can't get going, eventually this market stalls and we roll back down.
With thousands of stocks up more than 5% last week in North America, it was a pretty bullish thrust even though the indexes had a good week, but not as bullish as 5%.
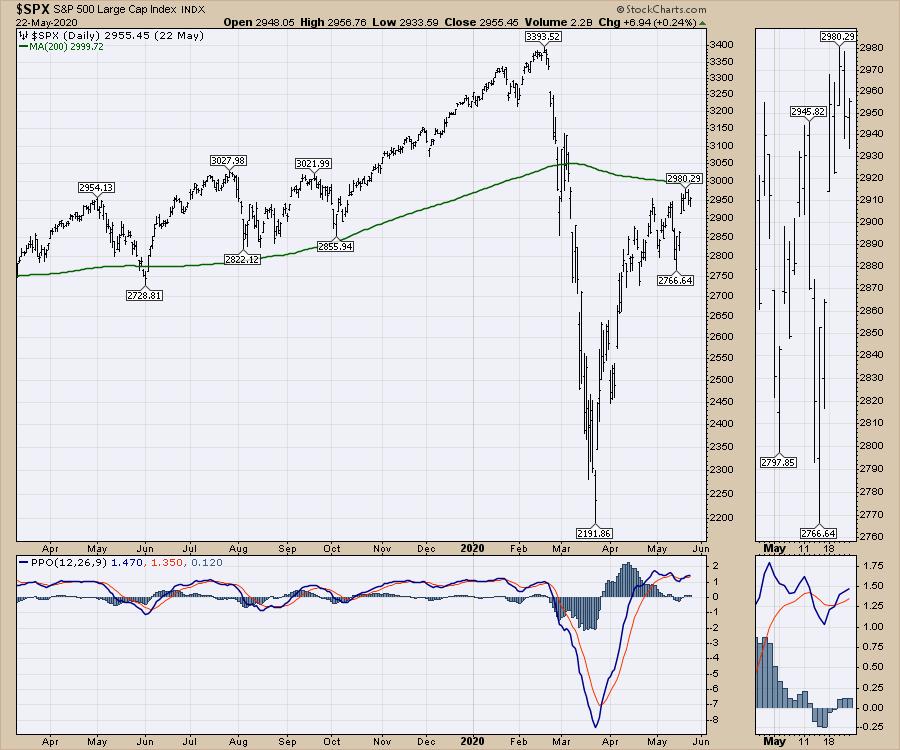
It looks like the futures are going to push the $SPX above the 200-day moving average to start the week. The important information is whether we can hold that into next Monday and keep the rally going. As stocks move above the 200-day moving average, that is a place where a lot of institutions will start adding to positions. Until then, they remain cautious. This could be the start of the next leg higher, or we could fail to hold above the 200 DMA and fall away. That would be a problem after the weakness we saw in the preceding week. It is now that the followthrough should show up.
Stay informed. This is a very important week to be chart watchful!
Good trading,
Greg Schnell, CMT, MFTA
Senior Technical Analyst, StockCharts.com
Author, Stock Charts For Dummies
Want to stay on top of the market's latest intermarket signals?
– Follow @SchnellInvestor on Twitter
– Connect with Greg on LinkedIn
– Subscribe to The Canadian Technician
– Email at info@gregschnell.com


