The Next Index Surge
Week after week, the market continues to rock to new highs. Oscillators stopped oscillating a while ago. The ascent of Tesla (TSLA), Apple (AAPL), Microsoft (MSFT) and Amazon (AMZN) will be a parable of our time after COVID. When everyone thought the world was going into a massive recession, these stocks attracted investors in droves. As the Dow Jones Industrial Average slowly changes to a Dow Jones Without Industrials Average, it appears to be catching some of the sunshine on the Nasdaq 100. Here is the current sector alignment.
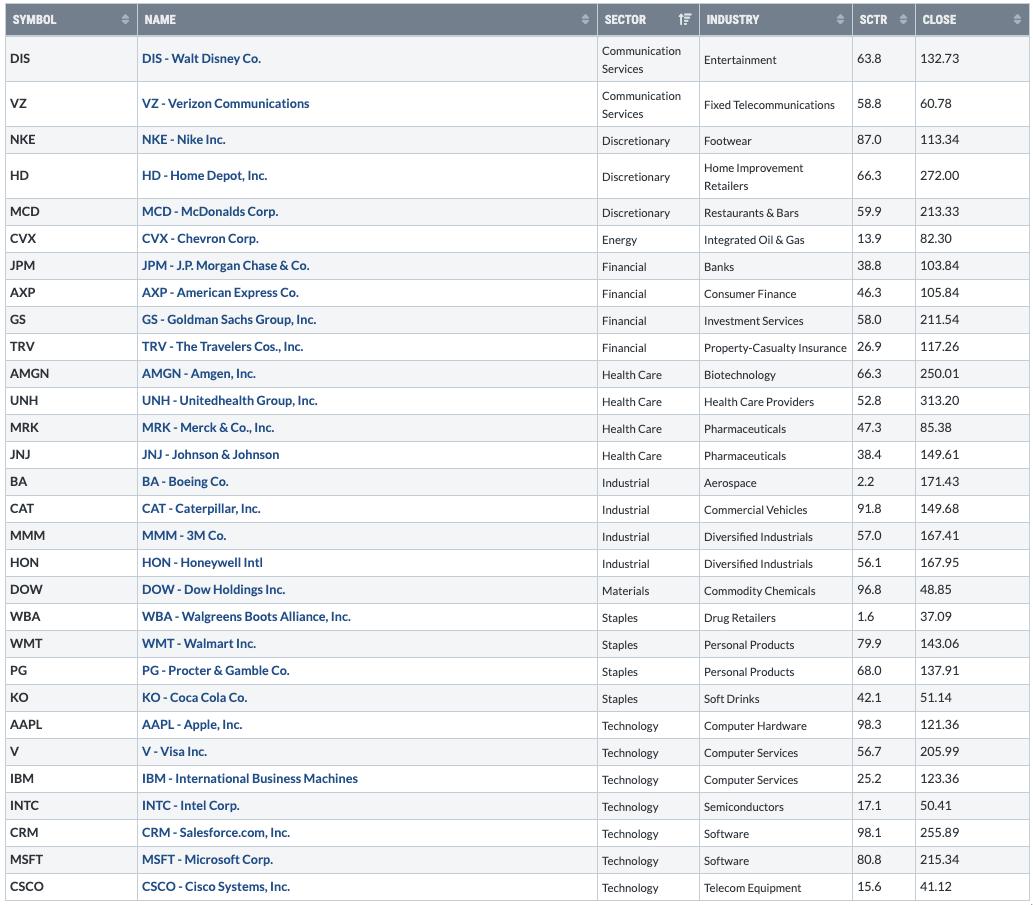
The energy sector has been reduced to a single stock. There are now only 5 industrials since GE got swapped out. As the DOW is weighted by stock price, before Apple split the stock price in August, it dominated the index. But we also shuffled the deck in other ways. Exxon Mobil (XOM) was tossed, along with Raytheon (RTX) and Pfizer (PFE). Honeywell (HON), Salesforce.com (CRM) and Amgen (AMGN) were invited to the club. The previous change had Walgreens (WBA) replace General Electric (GE). The list is constantly evolving, but one thing is clear: for the most part, it has dominant companies in it and is still an informative index. While it might not have the horsepower of the Nasdaq, it is a good reflection of broader market behavior.
Let's review the new entrants.
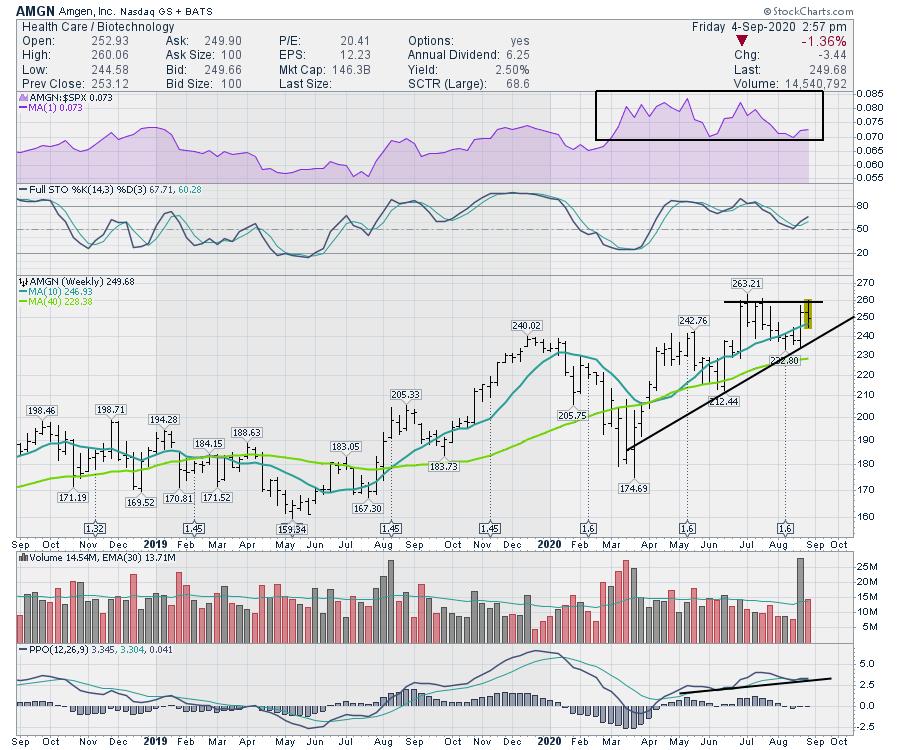
Looking in on AMGN, the chart is sloping up nicely into the top right corner. However, relative strength to the $SPX in the purple panel shows Amgen tracking with the SPX, with short-burst periods of outperformance. It is positive when this purple area tilts up. One of the things I like to look at is the price scale ($160-$260) and the top of this chart is little more than 50% above the base number - $160. As an example, on the Tesla chart, it is 1400% above the lower number over the same period. While AMGN is stable, it does not appear to be going anywhere fast.
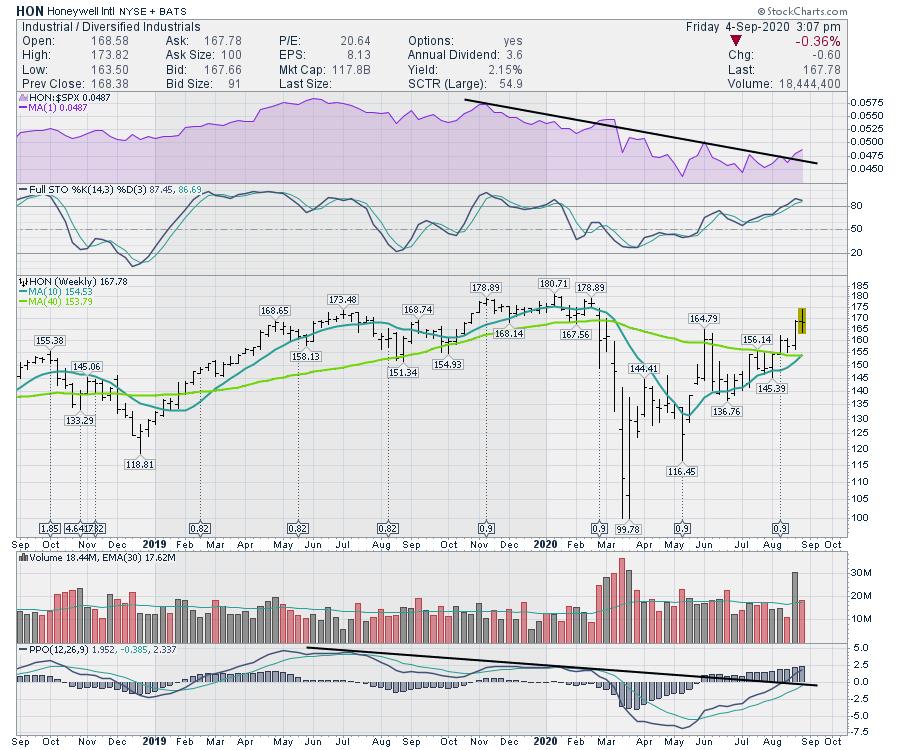
The next stock added to the index is HON. Honeywell is breaking out to new six-month highs. I like the chart shape as it looks to retest the highs. Referring to the scale, this stock is under a double from bottom ($100) to top ($180), which is stable once again.
The relative strength on the top panel continues to be in a mode of underperformance compared to the $SPX over the last year. Recently, it looks like that trend might be changing as it is moving above the black line. Lastly, I like the PPO momentum trend breaking and the indicator is close to making new 52-week highs ahead of price. This can be a nice reversal signal. Combine it with the potential for breaking the relative strength downtrend and the stock looks interesting.
The recent volume surge is on the announcement of being added to the average, so I would ignore the large volume bar for this particular week.
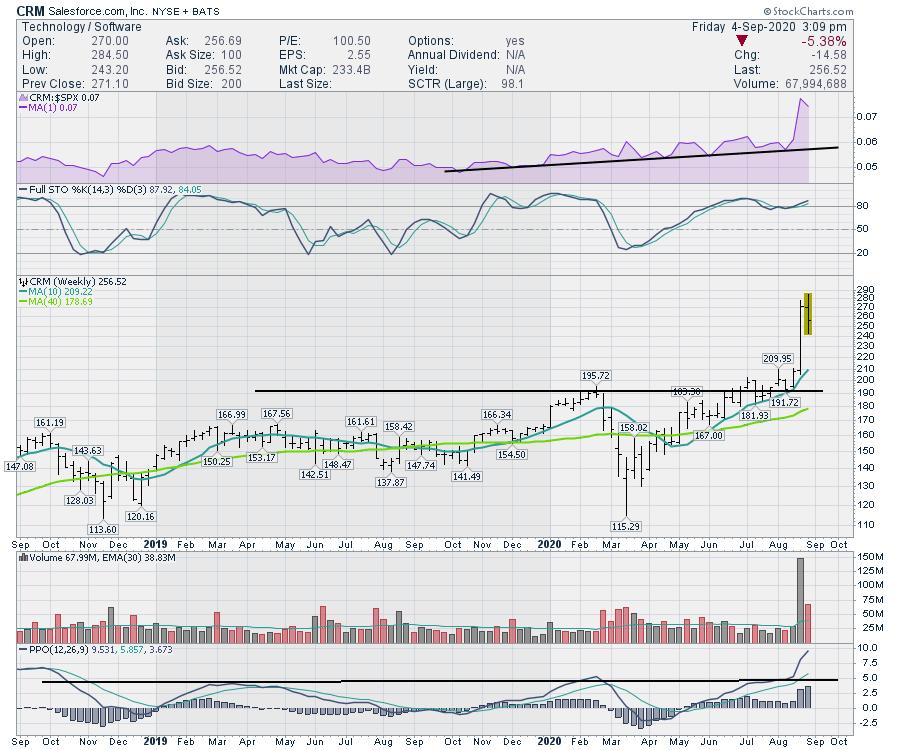
The new technology member to the club is Salesforce.com, CRM. The stock has been performing well but recently vaulted higher on earnings. The announcement of being added to the average probably helped, but the fuel for the move was in the earnings.
I like the big price base that CRM is breaking out of. While the stock was pushing higher anyway before earnings, it is well on its way now. This chart will add to the nimbleness of the average, so it won't be so far behind other indexes like the $SPX.
Notice the outperformance compared to the $SPX on the purple panel. The new highs in the stock are way more than marginal, and the spike on the purple panel shows the outperformance. Before the price pop, the top of the price scale ($200) would have been slightly less than a double of $110. Now the stock looks more attractive to me, but it would appear the selection for the average is probably based on more stable names.
For me, the names in the average are important stocks, but they are not usually the big trading names. As the list changes away from GE and XOM to more AAPL and CRM, it is definitely going to be more dynamic.
Perhaps we are seeing the change now that Apple and Tesla have split. All that to say, don't forget about the Dow. There are some new names, and the old guards may not be as good as they once were, but they are as good once as they ever were. That appears to be playing out in this big bull market.
Good trading,
Greg Schnell, CMT, MFTA
Senior Technical Analyst, StockCharts.com
Author, Stock Charts For Dummies
Want to stay on top of the market's latest intermarket signals?
– Follow @SchnellInvestor on Twitter
– Connect with Greg on LinkedIn
– Subscribe to The Canadian Technician
– Email at info@gregschnell.com


