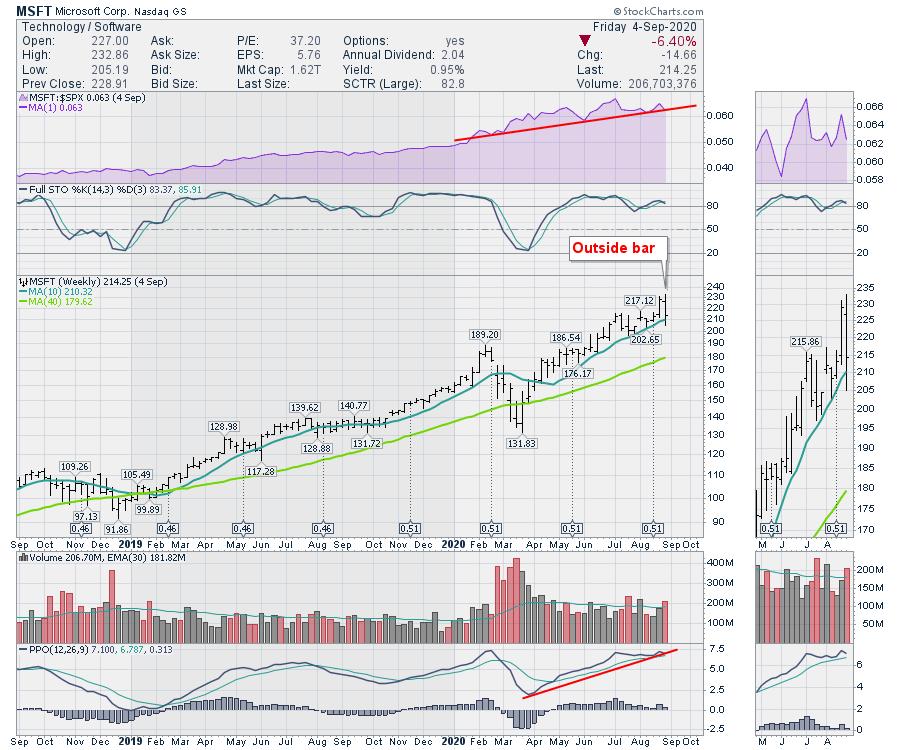
Over the past week, the big names had some swings. Many of these names have been riding the 20-day moving average. On a daily chart, lots of them touched the 50-day this week. The charts below are all weekly, so I'll use the 10-week moving average, which is roughly equal to the 50-day moving average. Microsoft (MSFT) has been a little lower slope, reaching back to the 10-week moving average (WMA) for the lows before bouncing after the rally began. This week, Microsoft checked back below the 10-WMA but closed back above. The stock has been on a steady advance for five years, but has a 12% range this week. The long 40-WMA is way down at $180, but both moving averages have nice smooth uptrends.
Netflix (NFLX) has been a COVID name as everyone was at home binge watching. Netflix has maintained following the 10-WMA, but it wasn't as reliable a low as on MSFT, moving slightly below each time. This week, the stock tried to move to fresh highs, but so far has some tweezer top price bars. Tweezer tops are very tall price bars back to back - one up, one down, with a quick reversal wiping out the gain. Netflix had a $70 range this week, which is ~15%.

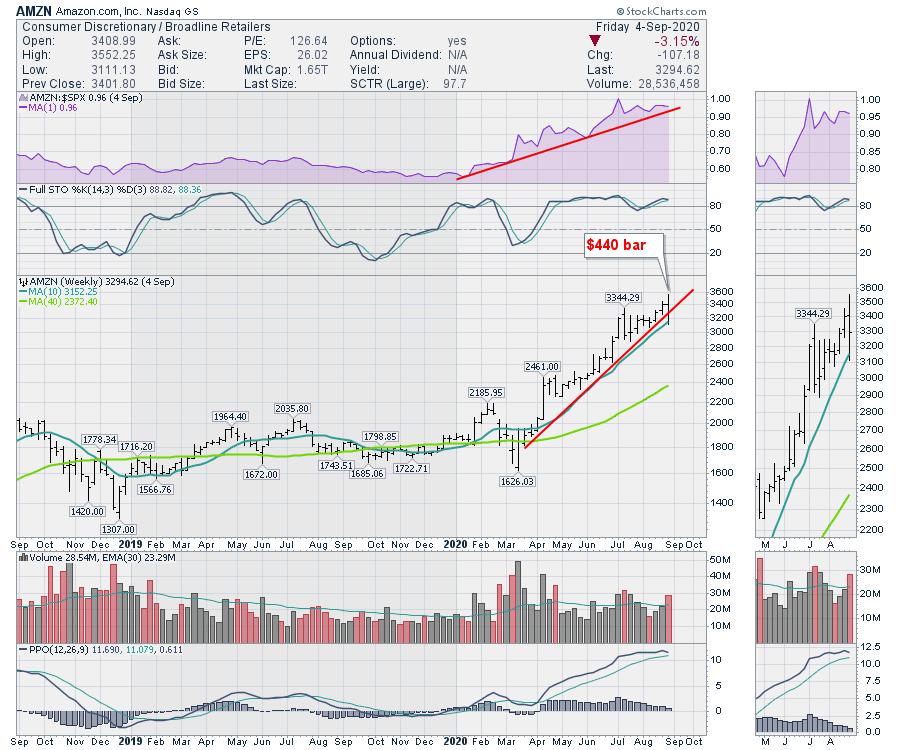
Amazon (AMZN) has been a wild ride this week. The stock has doubled off the COVID lows, but this was a particularly big week regardless of where you bought in. With a $440 swing, that rattles the morning cup of coffee. This is the first time the stock touched the 10-WMA since April.
The rest of the big names, Apple (AAPL), Tesla (TSLA), Alphabet (GOOG) and Facebook (FB) are still above the 50-day moving average and did not touch it this week. Tesla has a wide-ranging week of 25%, but only closed down 5% from the previous week. That is a huge swing to sit through. Big moves both ways, but the stock has been very strong.
While Tech had a big swinging week, the rest of the market was not as violent. After such a big run, this week will have more anxiety than the previous couple of months. We'll need to see tech hold up at these levels after such a wide swing. For longer-term investors, it is just an exhale after a fabulous run. For swing traders, it's pretty important to be on the right side of those swings.
Watching that 50-day or 10 week moving average will be a good reference point for support. Let's see if it holds.
Good trading,
Greg Schnell, CMT, MFTA
Senior Technical Analyst, StockCharts.com
Author, Stock Charts For Dummies
Want to stay on top of the market's latest intermarket signals?
– Follow @SchnellInvestor on Twitter
– Connect with Greg on LinkedIn
– Subscribe to The Canadian Technician
– Email at info@gregschnell.com