GM Tries To Block Tesla Premium Positioning
The electric vehicle news came surging to the fore this week. GM rolled out the vision for the new HUMMER "Super" truck. It has some unique features, like the crab walk and the removable t-roof from Burt Reynolds Smokey and the Bandit Trans-Am. What's old is new!
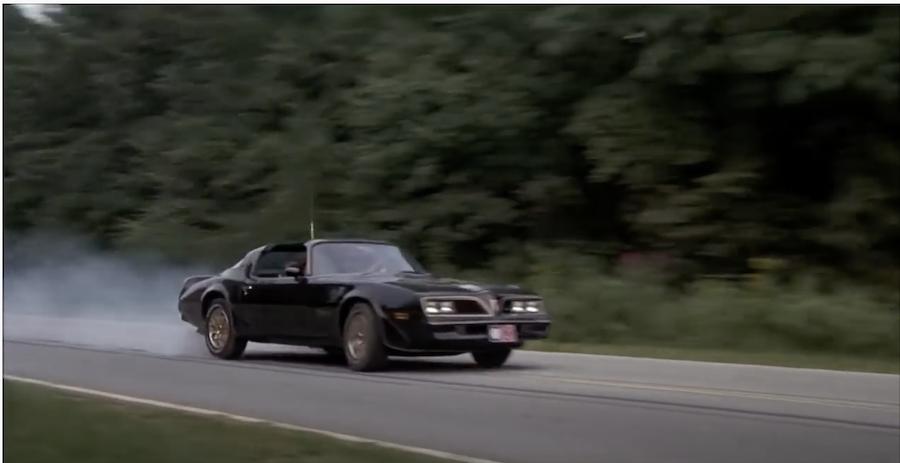 Just to get you in the high horsepower mood, follow the link to YouTube for a 3-minute flashback to the good ol' muscle car days.
Smokey and the Bandit
The truck is loaded with horsepower – as in 1000 of them-there horses. So much for eco-friendly! Are we going to go to huge vehicles with massive power, to put the thrill back in driving?
Pricing is 65% higher than the Denali line. The truck is due out next fall and the pre-orders for the limited edition #1 are already full. What does that mean to us as investors?
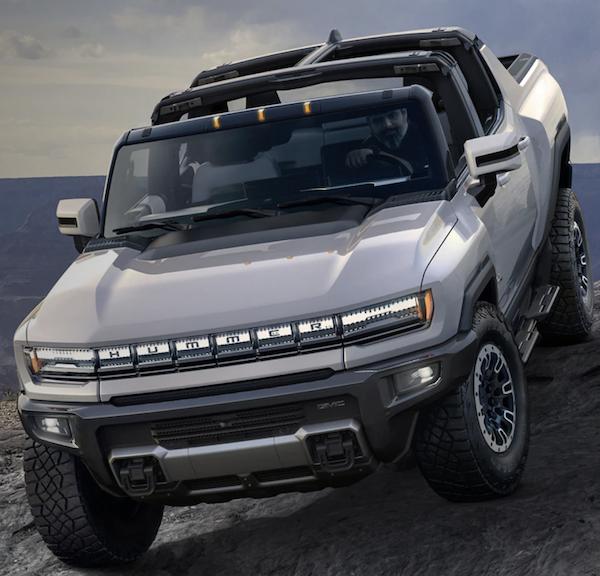 Image: GMC.com
First of all, looking at GM's chart below, this is well-received by investors. The stock has been shaping up and I pointed out in recent presentations that the stock looks set to run. I put a line on the volume chart and GM traded 106 million shares for the week, suggesting the close will be the second-highest volume "up-week" in 3 years. That's not Mom and Dad picking up 100 shares for the retirement account. That is institutional buying, stepping on the electric pedal (yeah, we have to throw out the gas pedal!).
From an indicator perspective, the technical ranking for the stock on the top panel is at the highest level in three years! If you think of a sports analogy like the NFL rankings week-to-week, you compare the price action of the stock compared to its peers to see who is winning. The price action, as measured by this ranking tool, puts GM firmly in the top 2% of its stock market large-cap peers - not just this industry, but the whole large cap space, including tech stocks.
The relative strength in purple is compared to the S&P 500. GM stock has been underperforming the S&P 500 for years. When this purple area chart is trending down, it is underperforming. Well, GM just broke to new 6-month highs. That is something we see in trend changes as the stock starts to outperform.
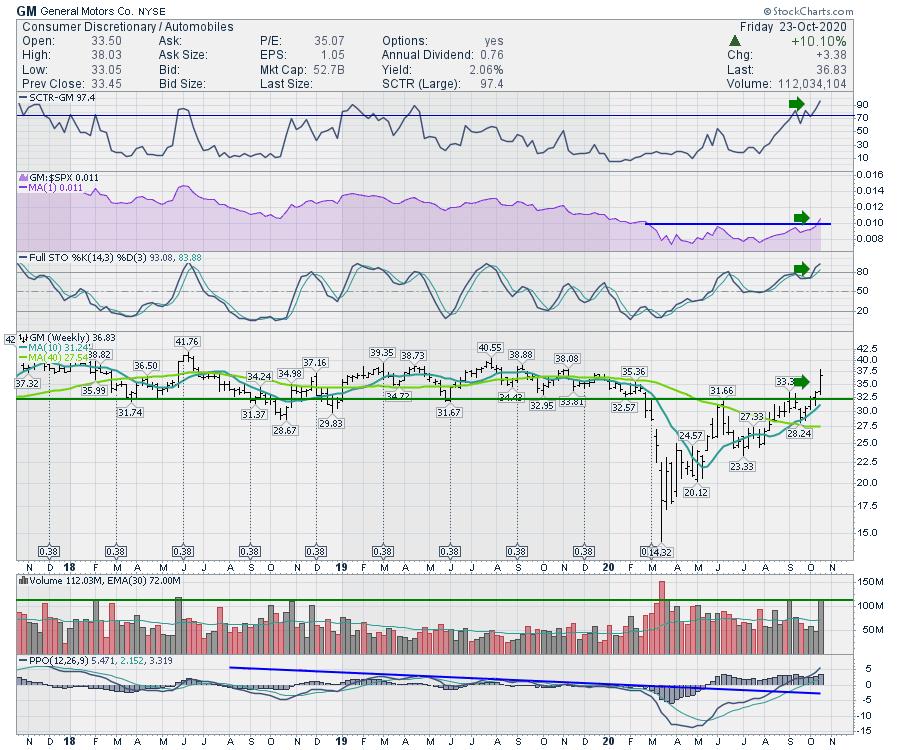
The full stochastics indicator is something we can use to help find stocks starting to outperform. When the stock is very strong in an uptrend, it typically stays above 50%. The price action is at the top of the recent range, which is what the full stochastic tells us as a percentage. It looks strong. It can stay up in the top half for months and keep moving above 80%.
On the price panel, GM has had trouble getting through the $40 range for years. That is now just above the current price; we would call that "overhead resistance." I would expect GM to need a few weeks to punch above that resistance.
Ford
Ford (F) is rolling out the 2021 pickup next year. It will be a hybrid, which seems slow considering the thrust to electric. My daughter's current company truck is a 4-door, 4-seat, short box, 4-wheel drive and it's just like driving in business class full time. Big seats, big comfort and the big name in company trucks in this part of the planet.
 Image: Ford.ca
Some of the unique features that come from electrically-powered trucks are the additional advantages of having a large charging station with you for other things. This is from the Ford 2021 truck, coming out with a complete power plant to run tools on the job site.
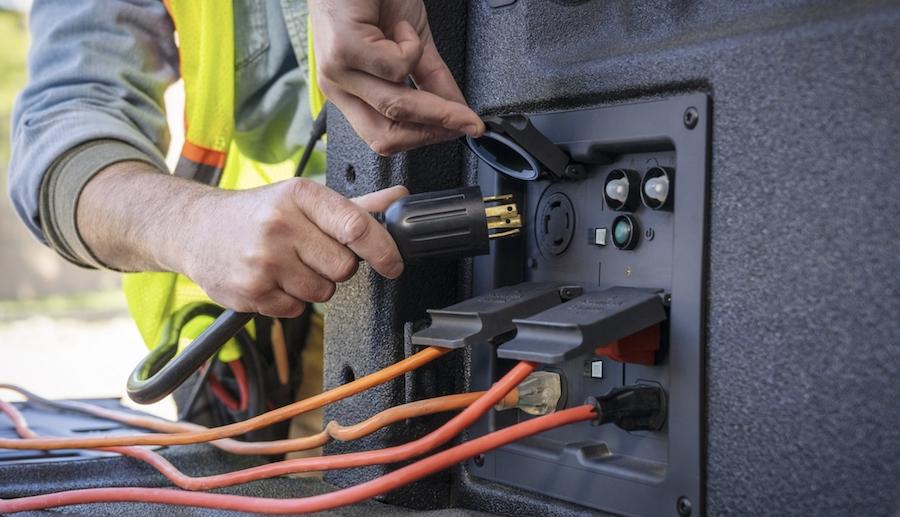 Image: Ford.ca
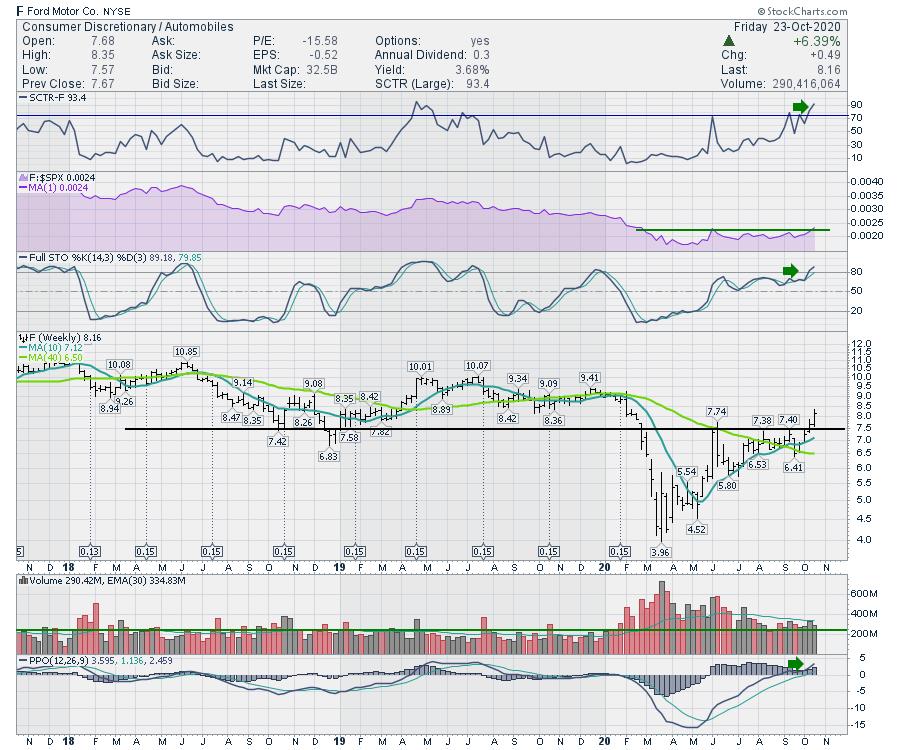
What does the chart tell us about investors' opinion of Ford as the 2021s hit the showrooms?
Ford is doing the same thing as GM. The stock is breaking out to the upside. The SCTR ranking (sports ranking analogy) is at 93%. That's awesome! It has only been there once in the last three years. The relative strength is breaking out to new 6-month highs, while the full stochastic is running nice and high above 80. In strong stocks, it can stay above 50 for months.
The last 4 weeks of positive volume have been larger than any four weeks pre-COVID, so somebody is getting interested in hitting the buy button! To wrap it up, the PPO momentum indicator is just moving above zero as the stock is breaking out. That's just a bullish place to be on board.
The competition is intensifying. Tesla (TSLA)'s higher-end interiors are beautiful and you can count on them for something different.
Tesla revealed their pickup truck about a year ago. They currently have 4 electric vehicles in the market already and are talking about India this week. The highway tractor for moving freight is also underway. Let's get back to the CyberTruck.
The CyberTruck is a visual change from pickups, bringing the idea of smooth design with blunt corners to really stand out. We'll know one when we see one!
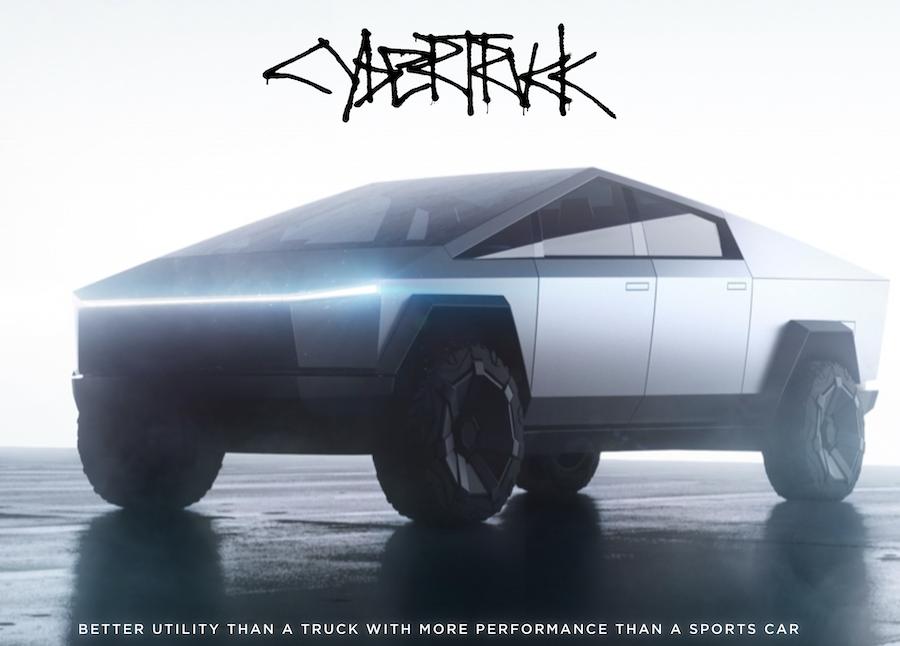 Image: Tesla.com
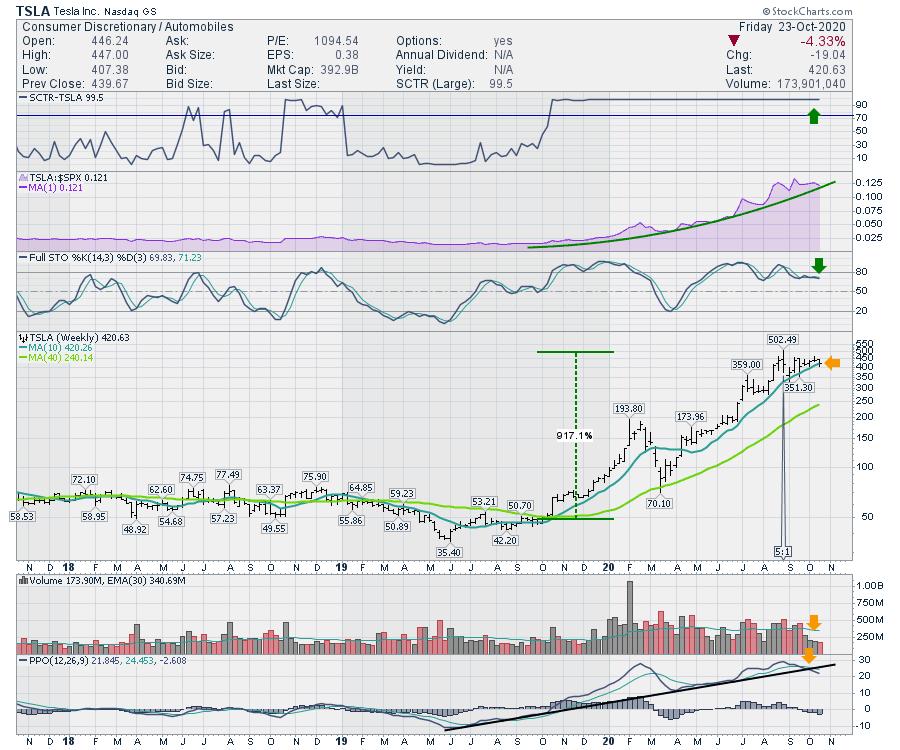
So how are investors responding as the competition intensifies? When we look at the Tesla chart, what do we see?
The SCTR ranking is pinned to the top as one of the best stocks in the market for a long time!
Relative strength to the S&P 500 is still nice and high. The full stochastic is one of the early clues of some weakness, as the stock is not able to hold above the 80% level anymore. It is still above 50%, which is a bullish condition.
Price is threatening to close below the 10-week moving average for the first time post-Covid. There has not been a lot of buying interest in Tesla, as the volume is the lowest volume since the company broke out about a year ago. Friday is not over as I write this, so there is still time for a little more to be added, but clearly the buyers are not pounding the buy button like they have in the past.
The lower panel is momentum and that trend line has broken. For me, that is a big clue that TSLA may be pausing here, especially when combined with the other indicators.
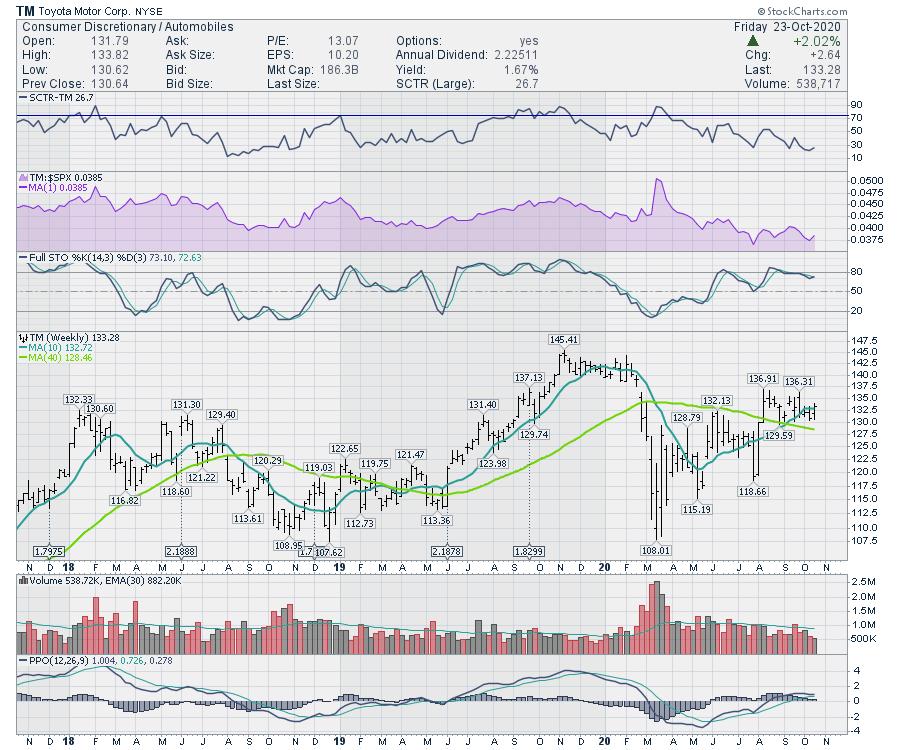
I have a good friend with the nickname of T-Square. He didn't design the CyberTruck, but someone with a T-square did! T-Square sells a lot of Toyota's through three dealerships. They can't keep trucks in stock post-COVID, so, next week, we'll check the charts of a few other names in the pickup space, focusing on those with electric alternatives. Where does T-Square's Toyota stock stand? Here is the chart. Check it out. What do you see?
You are welcome to share this newsletter with any of your friends. We are on a road trip and it's going to be fun!
If you would like to get the subscriber edition newsletter for Electric vehicles, click on the EV Newsletter tab, and scroll down to the EV subscription at GregSchnell.com.
 Signup for gergschnell.com by clicking on the image
Perhaps we can help zap your portfolio higher.
Good trading,
Greg Schnell, CMT, MFTA.
Good trading,
Greg Schnell, CMT, MFTA
Senior Technical Analyst, StockCharts.com
Author, Stock Charts For Dummies
Want to stay on top of the market's latest intermarket signals?
– Follow @SchnellInvestor on Twitter
– Connect with Greg on LinkedIn
– Subscribe to The Canadian Technician
– Email at info@gregschnell.com


