Another EV stock just made another double! The industry group is on fire! As they continue to surge, lots of the other names related to the electric vehicles have been flying.
I covered off trucks on my recent newsletter article; this edition covers off one more. I wanted to cover Dodge Ram (FCAU), Toyota (TM) and Honda (HMC), as they have made big inroads into electric vehicles and autonomous driving. They haven't jumped into the EV truck sector just yet. I'll cover them off in future newsletters, but let's stick with the truck theme.
There are so many new entrants into the truck business. Not all of them are public, but, for those that are, we can examine the stock price action of them as they bring out new models. The magical goal of these new entrants is to be as successful as Tesla (TSLA) was in the car space. Hard to imagine that will work out well. A wide part of the emerging industry is focused on trucks for Electric Vehicles (EV), as it is such a big profitable sector.
This newsletter is focused on the technical trading of a stock, rather than the "news" around the stock. "What are investors doing with their money?" is what a technician wants to know. By following price action, we can get some ideas.
The example below is a good one for price discovery of a single stock. Let's jump into it so you can see an in-depth version of technical analysis of a stock.
One of the new entrants is Lordstown Motors (RIDE). The truck in the picture below is for 2021, so it is ready for delivery. The base price is $52,500 from their website.
 Photo: Lordstownmotors.com
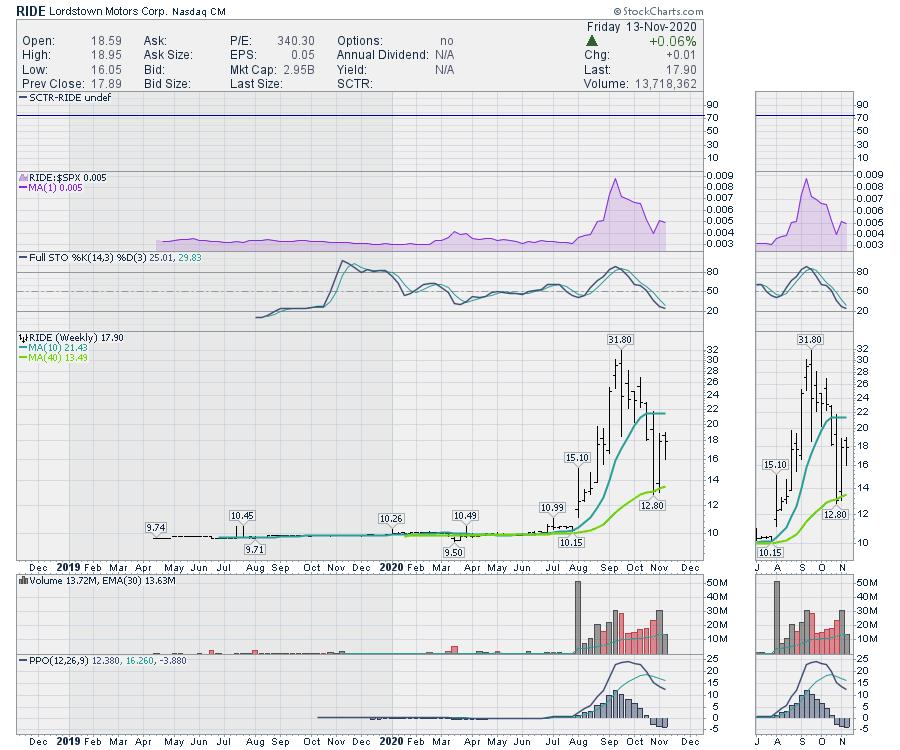
Because the company is a SPAC (Special Purpose Acquisition Company), the previous history on the chart before the breakout is irrelevant. As they announced Lordstown Motors (the truck manufacturer), the chart accelerated. It was another double off the surge.
I have one indicator at the top that is still blank. I used it on the previous newsletter (GM Tries To Block Tesla Premium Positioning). It is like a sports ranking for stocks, one that compares the strength of price moves against peers. The problem is that the stock is new, so it is not currently in one of the 3 groups to be compared against. I show it as empty here so that, when we look at other companies that have been around longer, that data will be included if they are large enough. I could have removed the panel, but I want to highlight that it can be important for helping compare companies. Companies like Tesla have had this indicator pinned at 99% for one year, as an example. You can see it on the TSLA chart in the aforementioned article.
The second panel in purple is the relative strength (RS) compared to the S&P 500. As the price surged, the stock started to move up faster than the S&P 500 moved. After the sudden surge, as the price dropped, the stock underperformed the index. Strong stocks have this RS indicator trending higher. When stocks start underperforming the index, investors move into something else outperforming.
The full stochastic keeps track of where the price is in the range of its recent history (14 weeks). It uses an average in its calculation, meaning it never gets to 100, but strong stocks in long uptrends hold above 50 on the weekly chart. As a percentage, is it in the top half of the range over the previous 14 weeks? By looking at stocks outperforming, this indicator is usually near the top.
The volume profile isn't that helpful yet, but, over time, we'll get a sense of the interest in the company. The surge in volume to 30 million shares two weeks ago on an up week, suggests interest is picking up.
The last indicator is the momentum indicator. On new stocks, this doesn't help much, but as the stock matures, we can see changes in momentum.
Price is settling around $18 for three of the last 4 weeks, so the stock is trying to base here. We'll want to see an uptrend start. Another double would be $36.
Because this company is so new, let's look at the daily price chart below.
The run up was wonderful - $11 to $31 in 7 weeks. We can make money catching those price moves. Notice the stock kept making higher highs and lows. As the stock rolled over the top, it moved down aggressively. I have labels the lows (L) and the Highs (H) in the downtrend. The stock made a series of lower highs, and that trend is not broken yet. It made an original low around $18.50, then a slightly higher low at $20. But then lower lows started to show up.
That's the definition of a downtrend. Lower highs and lower lows. Currently, the stock made a higher low this week, but has not made a higher high than Monday's peak.
However, for technicians, this is an important level on the chart. The green line on the left was support until price broke below. Now the stock keeps stalling at that level which we call resistance when we approach it from underneath. It is resisting the stock moving higher. Friday closed just below resistance once again.
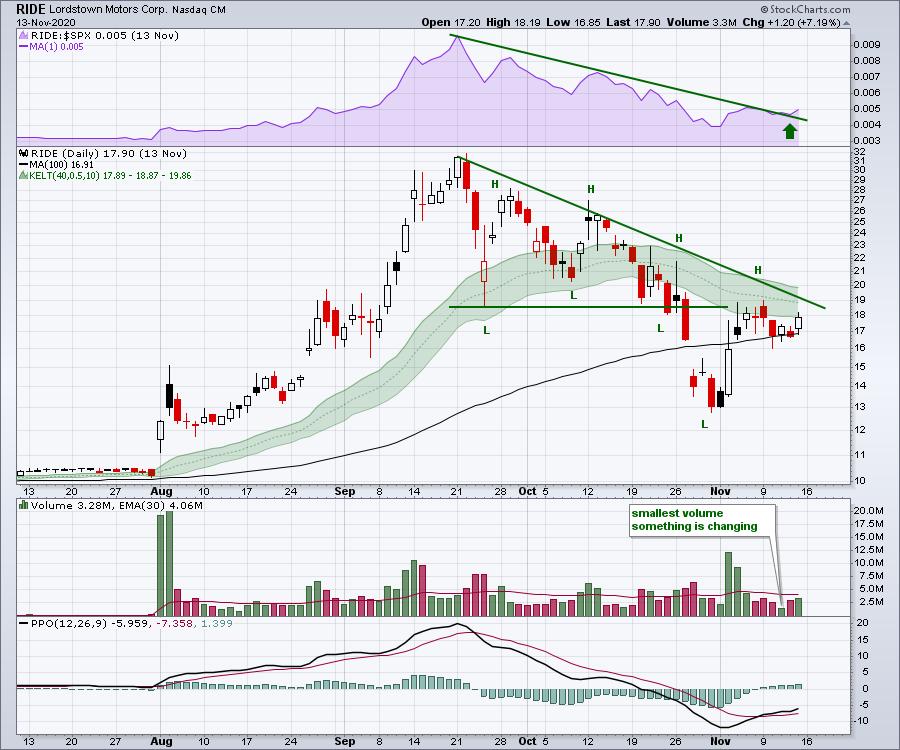
If the stock can push and close above Monday's high at $19, that would start a trend of higher highs and higher lows. It would also close above "resistance – the green horizontal line," which can be an inflection point for the stock. It would also be above the down-trending green line. That is significant on a short-term basis. It would be changing trend from down to sideways, and potentially up.
On the RS line (relative strength) on the purple area chart, we are starting to break above the downtrend. That can also be a clue of things changing. The large money managers are constantly trying to outperform against an index. If the stock starts outperforming (usually 3-month RS highs), that is worth noticing. In this fast-moving EV space, investors expect to outperform the index. This is the first clue of the stock starting to improve compared to its peers. It has to break the downtrend in RS.
On the back of the price panel, I have a green band running through the chart. It might be subtle on some screens, but if I make it dark, it overpowers the price action. During uptrends, we need to give the stock room to wiggle up and down. In general, the stock should be above that band. Currently, the top edge of the band is at $20. A move back above this band would be very positive and we could use the lower edge of the band as support again.
The PPO momentum indicator has broken the downtrend and is rising. That is also confirming the change in momentum. We'll need to see the stock follow through this week.
The last indicator to discuss is volume. The volume on Wednesday was the lowest volume since August 14th, the day the stock started its surge higher. At that time, we didn't have any volume history to work with. Now we have a significant change in volume (lower) after the big volume spike (higher). That's pretty similar to how August played out. It will be worth watching to see if the stock can change trend. Without getting into a full volume analysis here, volume can be a nice clue as part of the decision.
To conclude the technical analysis, a technician would like to see the higher highs above $19 to get into the stock, and the stop would go with a close below $18. Entry into the stock would be above $19 or $20 depending on the technician's strategy.
This gives you an idea of what technicians are looking for, rather than listening to the news. We want to see what investors are doing with their money. If this stock is about to change trend, it is because investors start to push the stock price up. This will show up on the charts. Investors have to be willing to pay higher prices to push the stocks up.
How's The Track Record?
The subscription EV newsletter has had lots of winners pointed out already. Let me cherry-pick and show the chart of XPEV, which we added to the stocks to watch on October 8th. The next day was the lowest volume day. Since then, the stock has made higher highs and higher lows, hitting $50 on Friday. Another double and then some.
 Another Double!
Here is PLUG from October 2 watchlist. Almost another double.
 Almost Another Double!
The most recent newsletter suggested SOLO as one to watch on October 30th. Another Double.
 Another Double!
If you are interested, you can find the link to the subscription service here. They are not all winners, but it is nice to have some names to work with each week for $97 per year or $2/week. There are some other names we are still waiting on for another double. Subscribers can review all the previous newsletters in the EV section of the website.
Good trading,
Greg Schnell, CMT, MFTA
Senior Technical Analyst, StockCharts.com
Author, Stock Charts For Dummies
Want to stay on top of the market's latest intermarket signals?
– Follow @SchnellInvestor on Twitter
– Connect with Greg on LinkedIn
– Subscribe to The Canadian Technician
– Email at info@gregschnell.com
