Friday morning saw Bitcoin's price bar dip under $47,500. This took out the March low, so we now have a lower low in place. While the Bitcoin bears have been clamouring to be right, the price move down of 27% from a week ago has given the opportunity to make money on the downside move of the coin price. Technicians will be looking at $42,000-$43,ooo as a support level. With Bitcoin ranging $5000 / day, that can be just a day away.
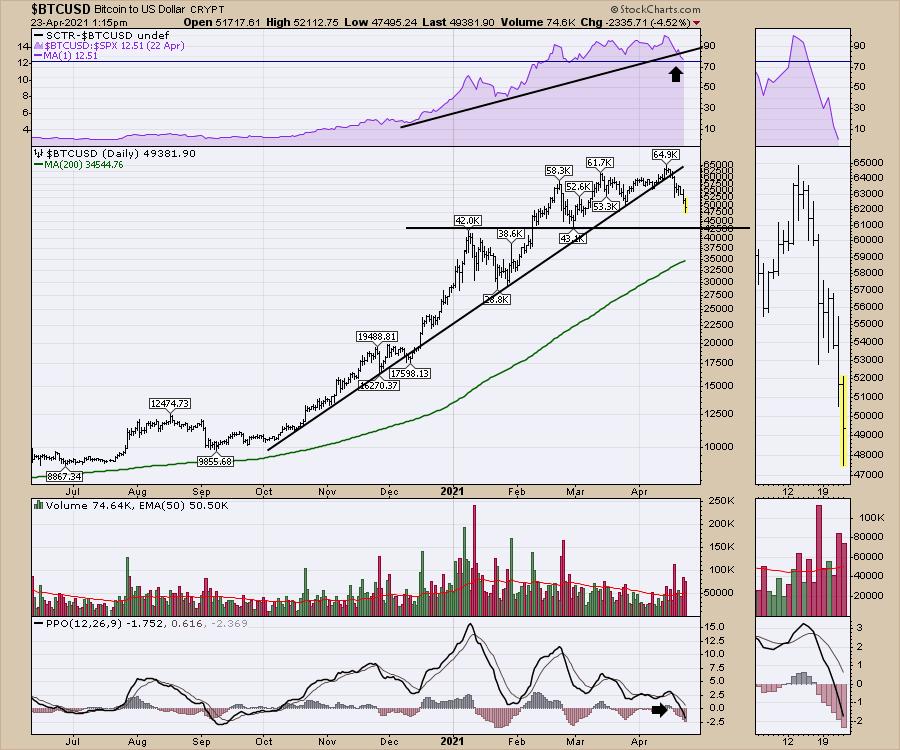
One of the things I am noticing is the momentum waves shown by the PPO are getting lower on every rally since the beginning of the year. It is also notable that the PPO is moving below zero for the first time since September. The real question is, does momentum dip like September and start to rally at $43,000 as support? Or has Bitcoin lost its momentum for a longer period of time, with $28,500 and $19,500 acting as the next support levels?
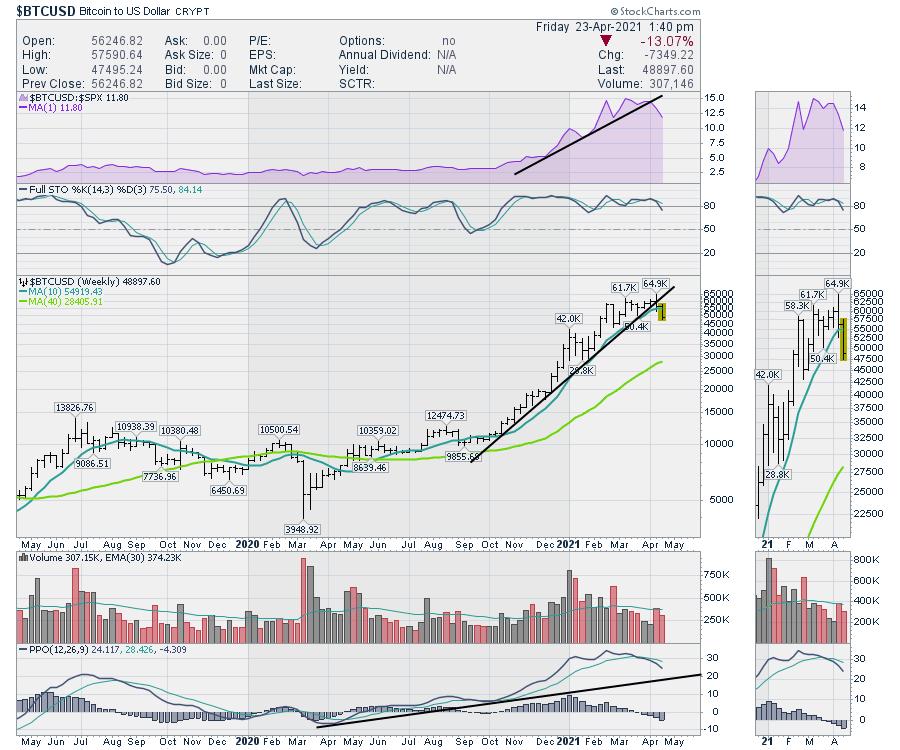
Using the weekly chart, the situation looks more significant than just a bounce at $43,000. When I see big changes in relative strength, that is a caution. The uptrend in relative strength is shown on the purple area chart. The real issue is that Bitcoin's outperformance has broken the uptrend. When something that was outperforming the S&P 500 significantly stops outperforming, that is a sell signal for me. Not only is it not trading in line with the S&P 500, it has started to underperform since the beginning of April. Now the price trendline is breaking and the PPO sell signal that we saw 4 weeks ago was a good signal to avoid a 27% move down.
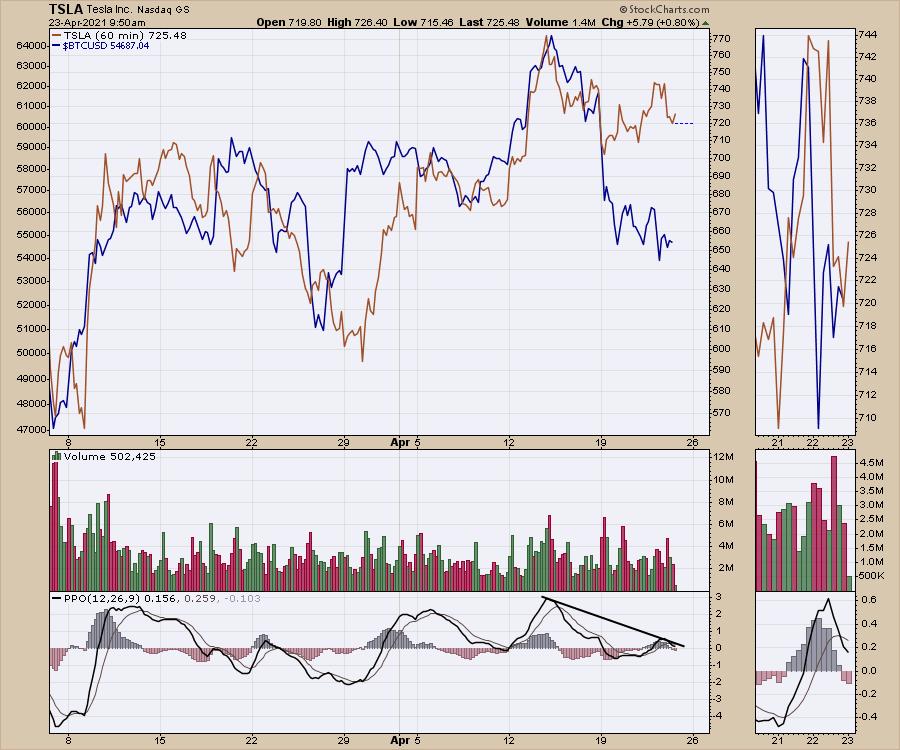
One of the concerns is that Bitcoin has been moving as a proxy for momentum trading or growth investing since the Nasdaq high in February. Some ways to view that are just simple line charts. Is Tesla (TSLA) starting to separate from Bitcoin?
How about ARK funds? Here is Cathie's K fund (ARKK). The brown line represents resistance for the Innovation ETF. A break above $130 would create a higher high and a higher low, which is the definition of an uptrend.
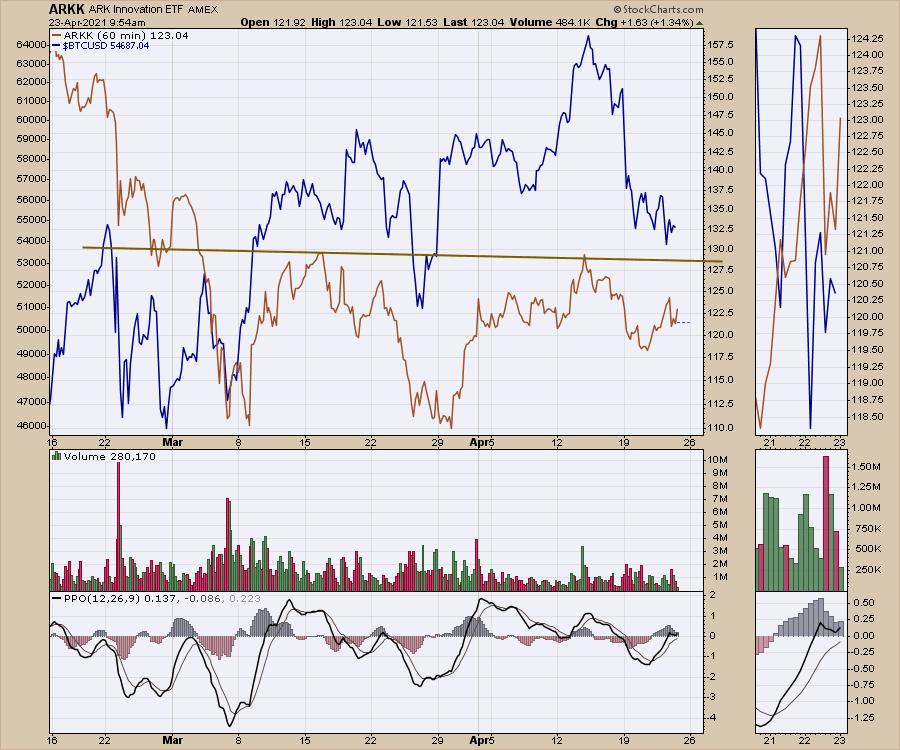
Probably the best view for a return to growth is the breakout in all of these ARK funds. It doesn't seem to matter what they are invested in; they are trading off the same computer algorithms.
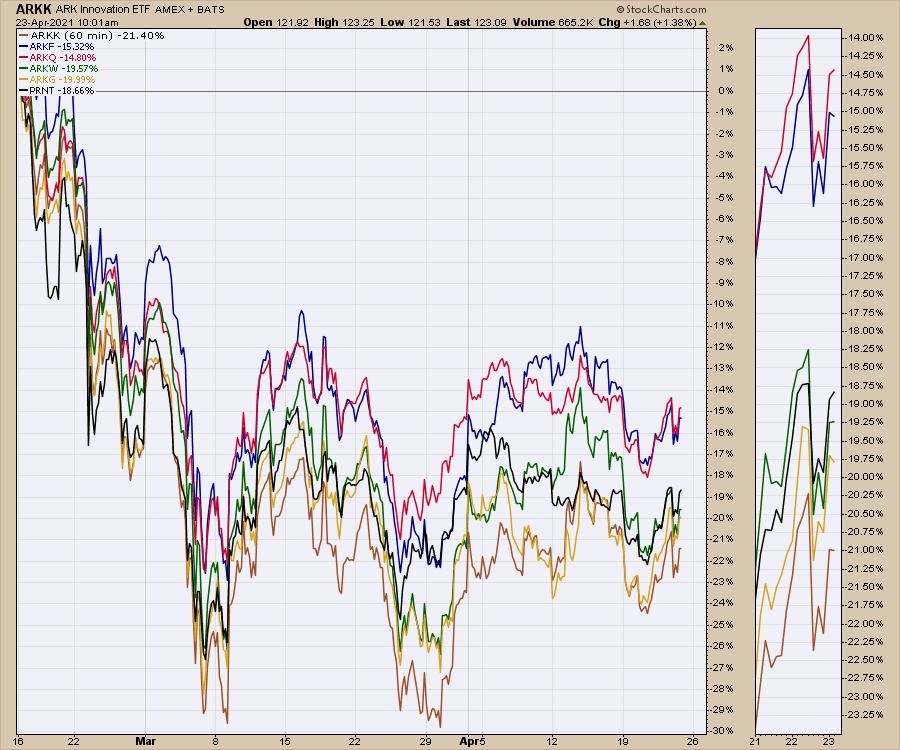
So the view for Bitcoin is that it needs to build a base, and the ARK funds are also trying to build a base. A return to these more speculative/momentum investing styles is probably when the ARK funds break out of the base. Lots of stocks within the funds are concept stocks or stocks that are early in their growth with little to no positive earnings. As the market takes a risk-on approach, we should also see the volumes in the ARK funds increase, as the volume has been decreasing over the last two months, shown on the ARKK and Bitcoin chart (two charts up). Recently, the momentum has moved into the large-cap tech and, until these charts start to disrupt that flow, it would appear that the mega-cap names are the place to be hiding.
Good trading,
Greg Schnell, CMT, MFTA
Senior Technical Analyst, StockCharts.com
Author, Stock Charts For Dummies
Want to stay on top of the market's latest intermarket signals?
– Follow @SchnellInvestor on Twitter
– Connect with Greg on LinkedIn
– Subscribe to The Canadian Technician
– Email at info@gregschnell.com


