When climbers climb mountains, they are more fearful and cautious at the top. When investors climb mountains, they get more bullish at the top and fearful in the valleys. It's an interesting dichotomy.
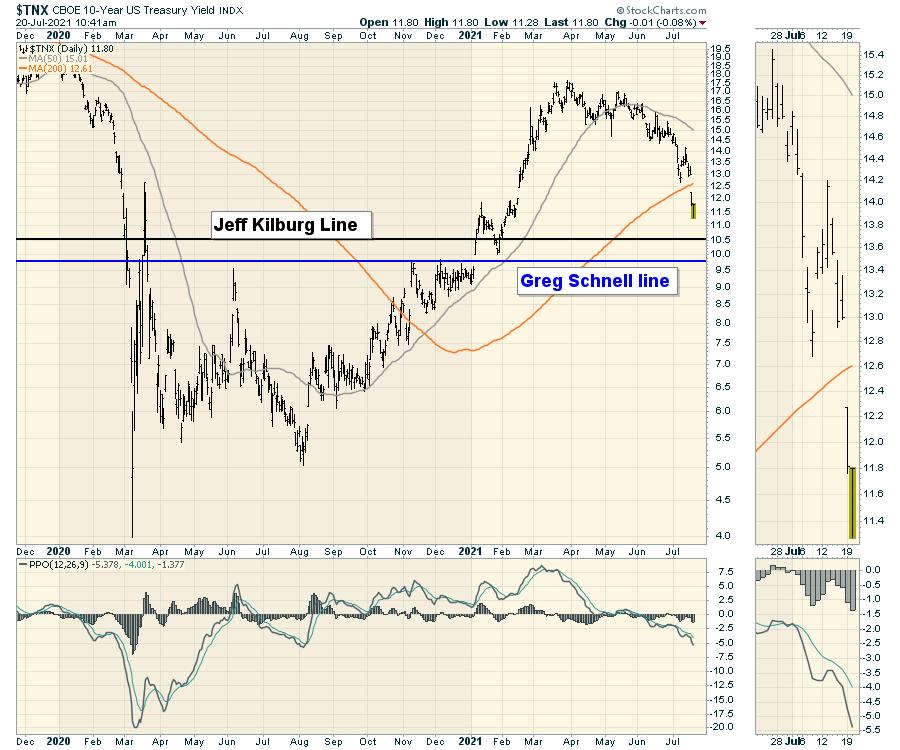
The chart that makes me work even harder after Monday's action is the 10-year yield chart. What the heck is going on with yields? And, if yields start to improve, will investors move to value or growth?
On Twitter this morning. I noticed Jeff Kilburg had picked a level of 1.05, which, on this chart scale, would be expressed as 10.5. For me, support/resistance is 0.97%, which I have drawn as the blue line.
However, perhaps he is using Fibonacci levels? The bounce earlier in the month was right at the 38% retracement. The bounce Monday was at the 50% retracement and the 61.8% level of 9.8 looks closer to my 9.7 than Jeff's 10.5.
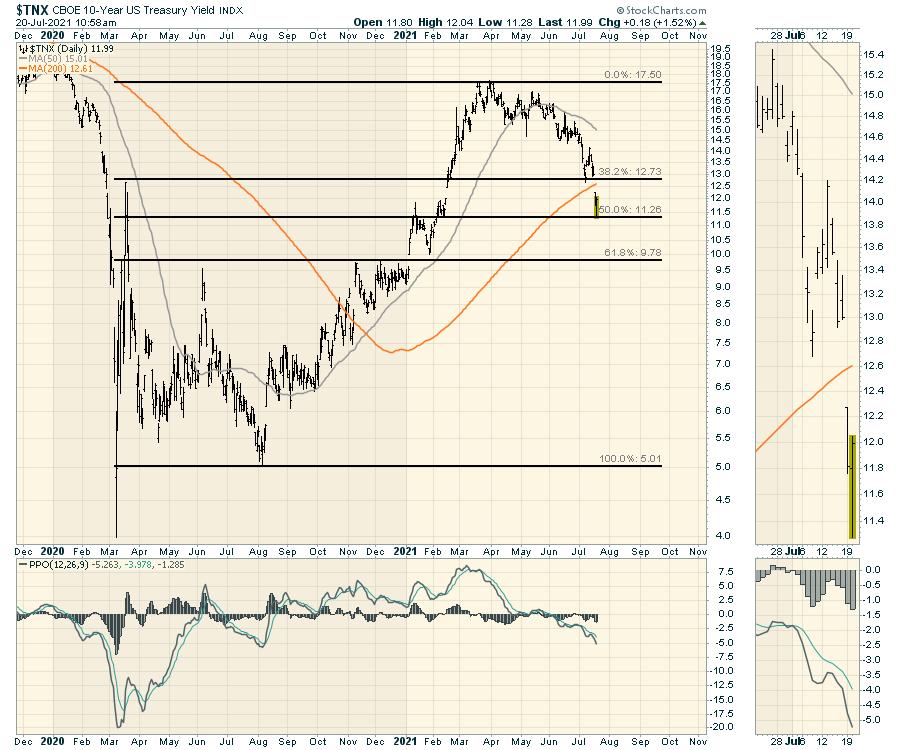
All of those Fib levels look like reasonable places to expect a bounce, and so far the 50% level is holding.
I have one more tool that I like to look at, which is the PPO level over time. Currently, it is at -5. This is also a reasonable place to expect a reversal and the downward thrust on the $TNX would need to be over if the PPO was to start to turn up at historical levels right around here. So Jeff's line is closer than my line.
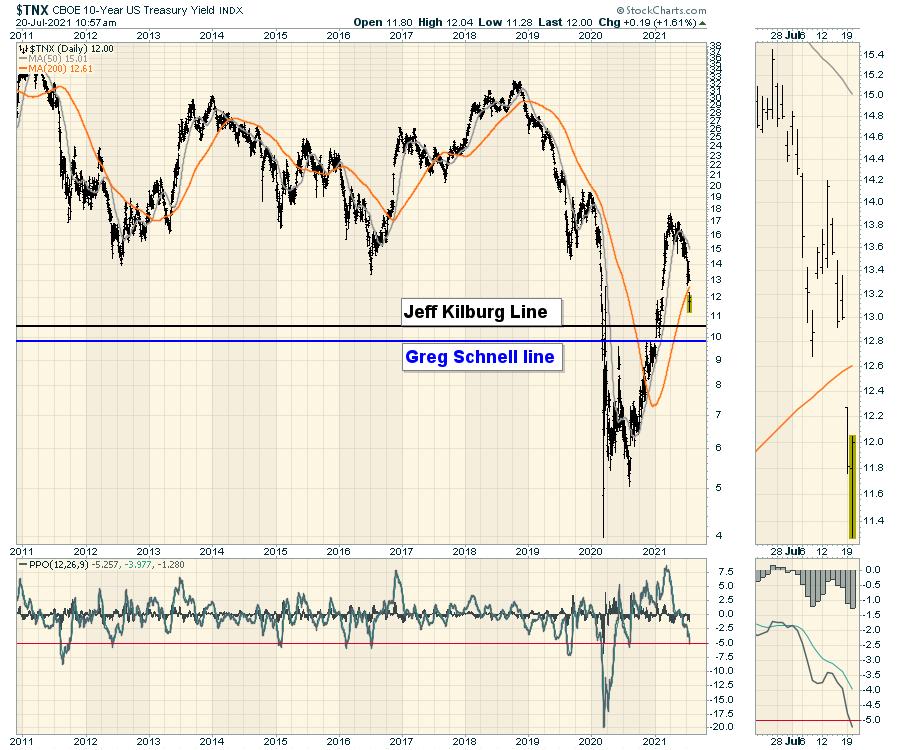
Whatever final level this picks, we are close to the bottom in 10-year yields. The 50% retracement, the Jeff line or my line which corresponds with the next fib level of 61.8%, all are good. I still don't know why Jeff picked that level and, as an active trader, it's worth keeping in mind.
The next question to be asked is: Where to next? Back into banks, if yields were to start rising again? Or commodities? Or growth stocks? I'm not sure which, but, as the market tries to find support, that will be big on my mind to buy the dip in the valley of fear rather than the peak of euphoria.
Good trading,
Greg Schnell, CMT, MFTA
Senior Technical Analyst, StockCharts.com
Author, Stock Charts For Dummies
Want to stay on top of the market's latest intermarket signals?
– Follow @SchnellInvestor on Twitter
– Connect with Greg on LinkedIn
– Subscribe to The Canadian Technician
– Email at info@gregschnell.com


