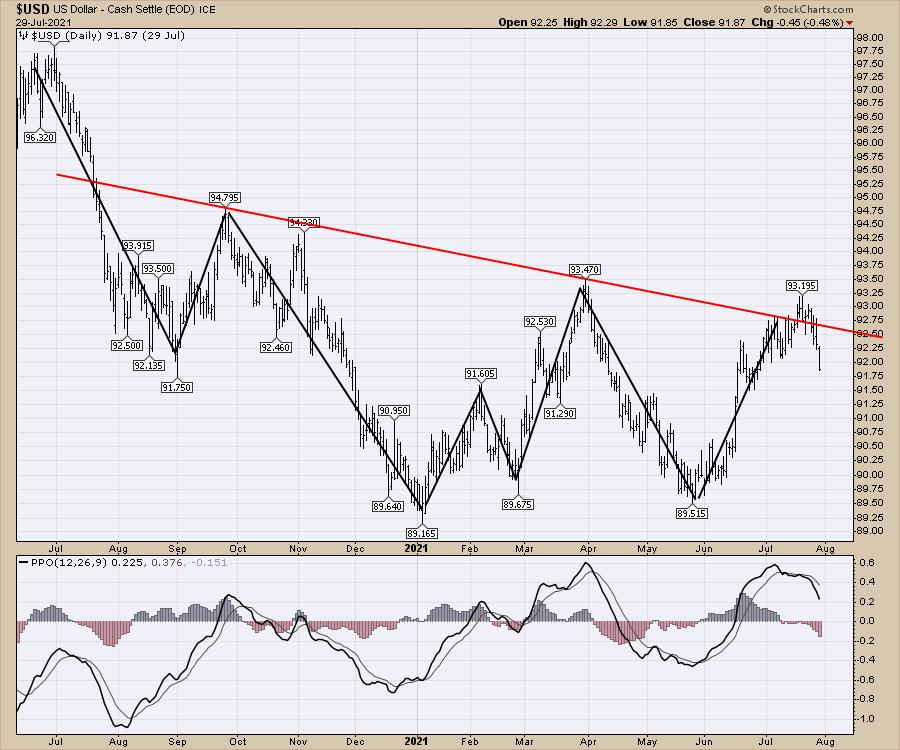
The dollar sits at a key level. It broke the downtrend, but failed at the breakout to a higher high at 93.5. So far, the dollar looks comfortably on the way lower. Friday's price action is not shown.
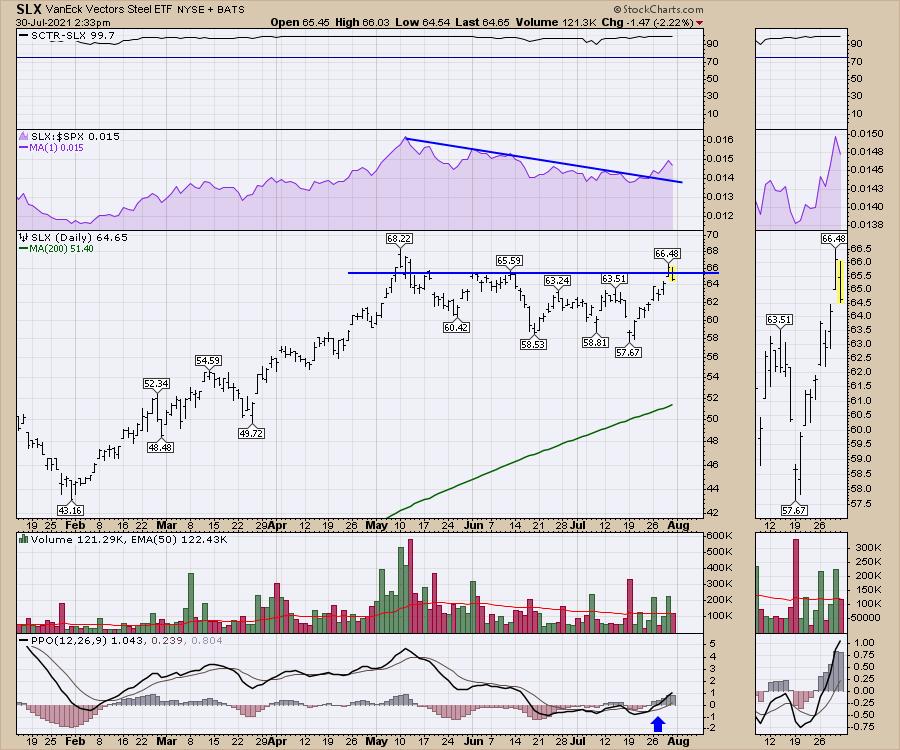
The commodities markets surged nicely this week on the back of a weakening US Dollar. However, the steel chart is at a very important level to keep going from. The breakout Thursday to 2-month highs looks great. The failure to hold that breakout Friday looks concerning! One day does not make a trend, but we need to see the steel stocks behind this ETF continue higher.
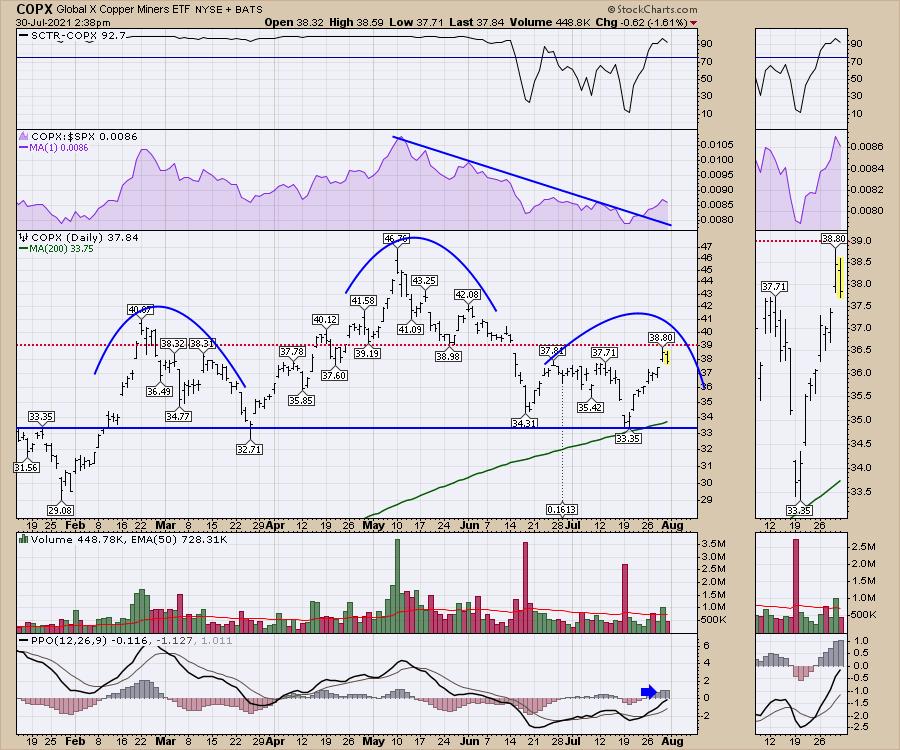
Secondly, the copper miners also look strong, but this is an important level to keep going from. Currently, there is a potential topping structure in place with a neck line at $33. The chart is trying to make new one-month highs in relative strength (shown in purple). I do not like the chart stalling Friday at the $39 level, which just happens to be the major support/resistance line (red) for the chart. It's important to see this follow-through, as the momentum rolling over at zero (PPO) would point to a problem.
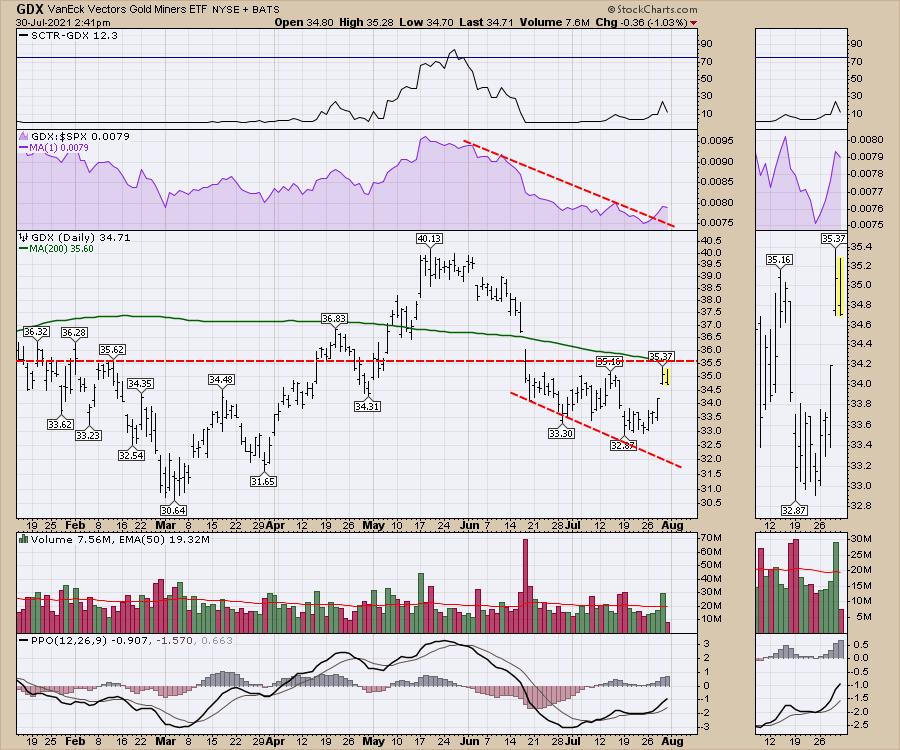
Lastly, the gold miners. These have been weak since they topped out a year ago. The relative strength in purple is trying to make new one-month highs. Currently, the chart is stalling below the 200-day moving average and the horizontal support resistance line in red. If the dollar continues lower, I would expect this chart to pop meaningfully.
While these all looked great on Thursday, the weight of the market on Friday looks heavy, as all the indexes were declining to end the day, the week and the month.
It's an important place to pay attention to both the dollar and and these metal-related ETFs. I expect a breakout to the topside. Will I be on the right side of the trade? We'll know more next week.
Good trading,
Greg Schnell, CMT, MFTA
Senior Technical Analyst, StockCharts.com
Author, Stock Charts For Dummies
Want to stay on top of the market's latest intermarket signals?
– Follow @SchnellInvestor on Twitter
– Connect with Greg on LinkedIn
– Subscribe to The Canadian Technician
– Email at info@gregschnell.com


