Lumber has been on a remarkable ride this year.
 Up 6x on the lows of last year, it quickly plummeted to being less than a double. What I find important to recognize is that the chart bounced off support at $440 and is now up $100 from the low in a week. Talk about trading ranges!
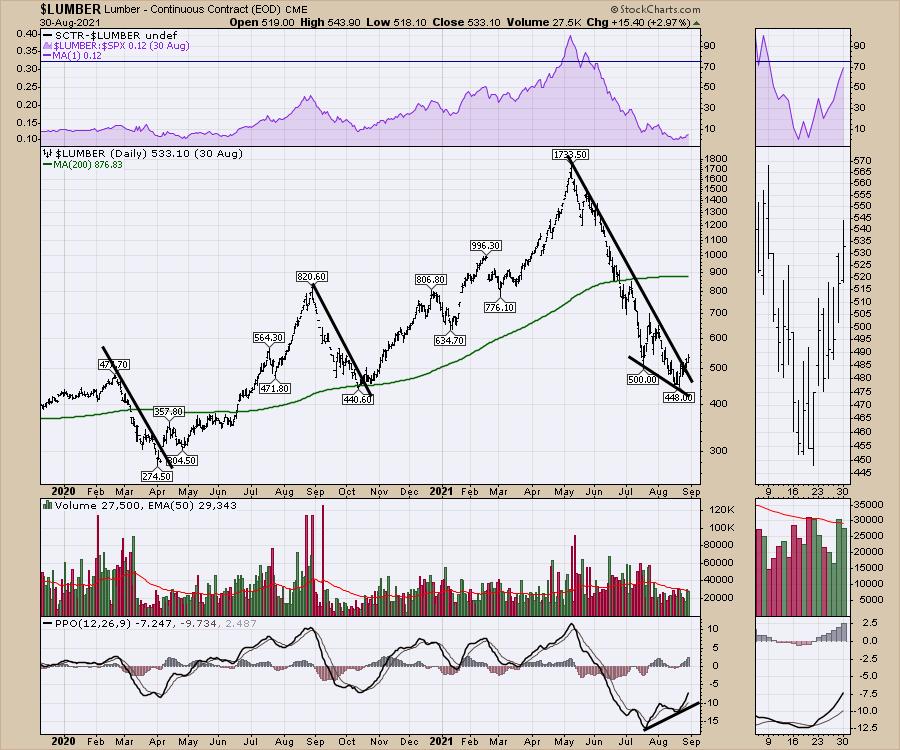
Based on the other steep downtrends on the chart above, this is not lumbers first felling competition. It goes with the business and it goes fast. Add on the tariffs and WTO trade disputes and this is not a simple trading environment. But it is a good one on the uptrends.
A longer look at lumber makes it more compelling here.
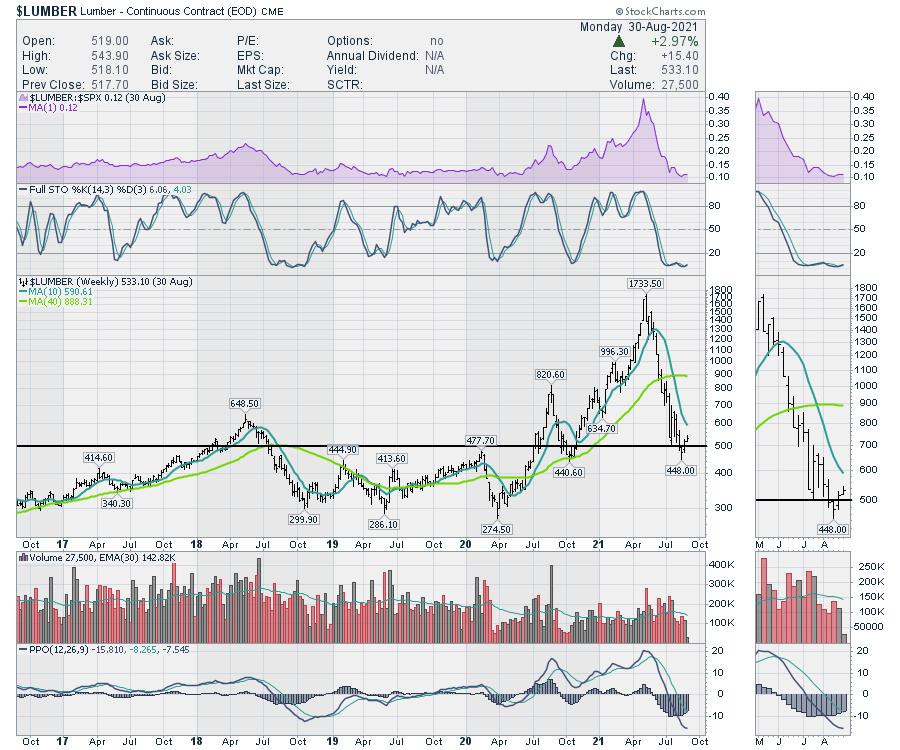
For newer investors, the reason the chart is more compelling here is that the market typically topped out around this $500 level historically. For technicians, what was resistance becomes support. If it stalls here and trades lower than support, we can leave our positions with the stop relatively close.
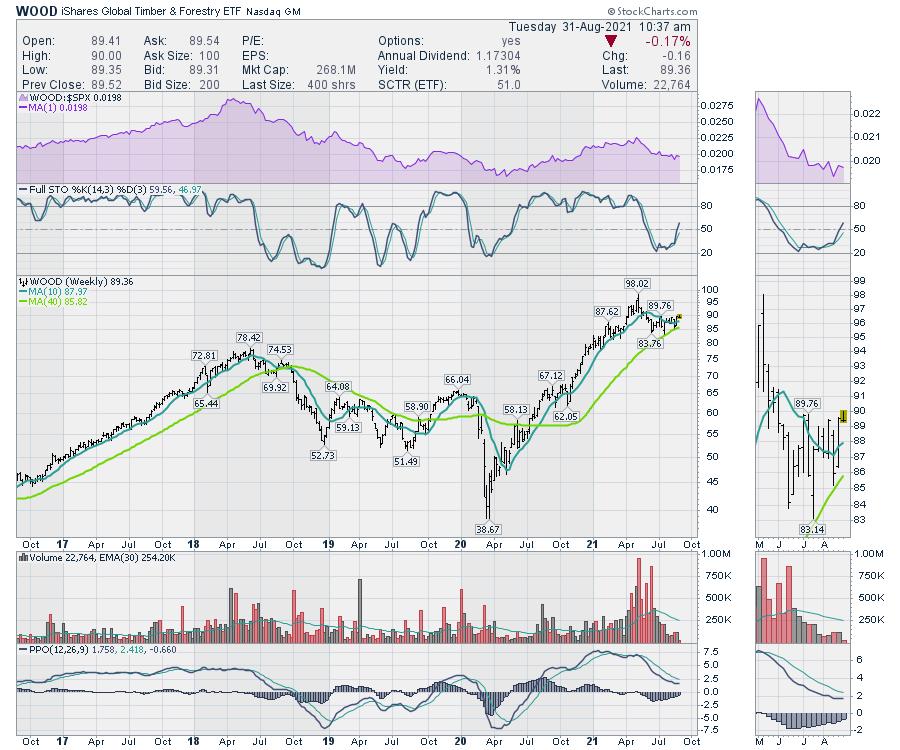
Below is the chart of lumber companies, compiled into the WOOD ETF. The volume is light, but it does give us a sense of the trend. Right now, $90 is a friction level for this ETF.
Zooming in on the daily, the resistance line is meaningful. It was support for the peak and this is the third rally test. If it breaks out, that is an entry signal with a tight stop. While a tight stop is always a good idea, the problem with this pattern is that a false breakout can quickly drift to the bottom of the range at $84. If it fails to break out, no entry.
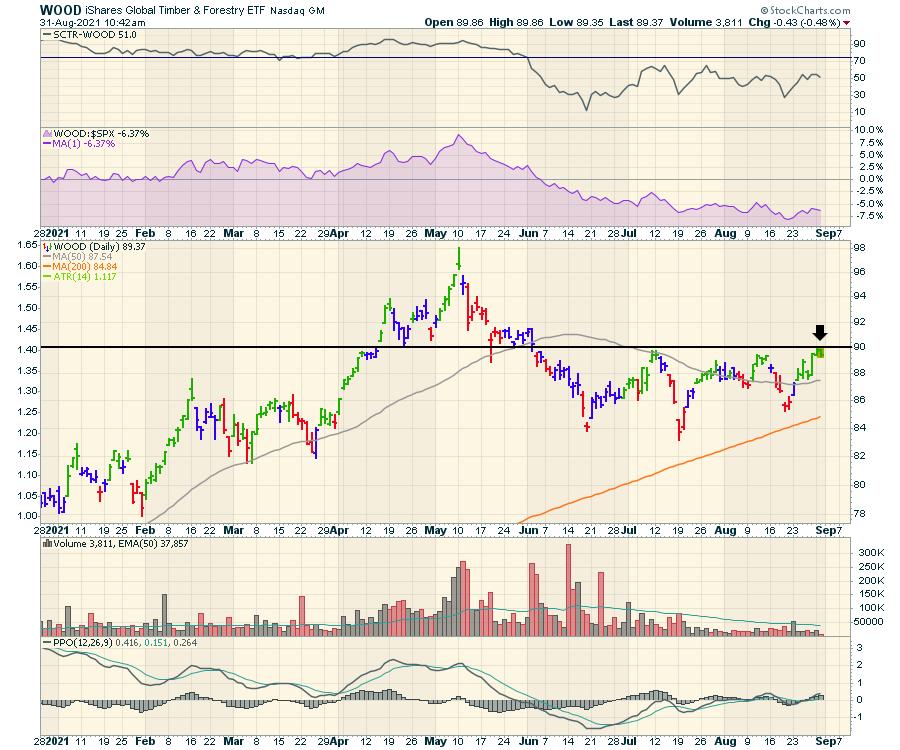
While the lumber chart is interesting here for an entry, typically futures traders trade the commodity. The companies related to the commodity can be traded individually or through the ETF. At this place in time, it is good to be watching WOOD for a breakout, with full recognition of the importance of a stop.
Good trading,
Greg Schnell, CMT, MFTA
Senior Technical Analyst, StockCharts.com
Author, Stock Charts For Dummies
Want to stay on top of the market's latest intermarket signals?
– Follow @SchnellInvestor on Twitter
– Connect with Greg on LinkedIn
– Subscribe to The Canadian Technician
– Email at info@gregschnell.com


