In a market where stocks are moving higher, this was a wild week. Not just to the upside, but the number of stocks that were smoked by big drops in their stock prices was large this week. I am demonstrating technical tools for exits, as there are exit signs at Costco, but not on a stock. I'll show you a few of the tools I use to help spot an exit close to the top and how that applies to today's market.
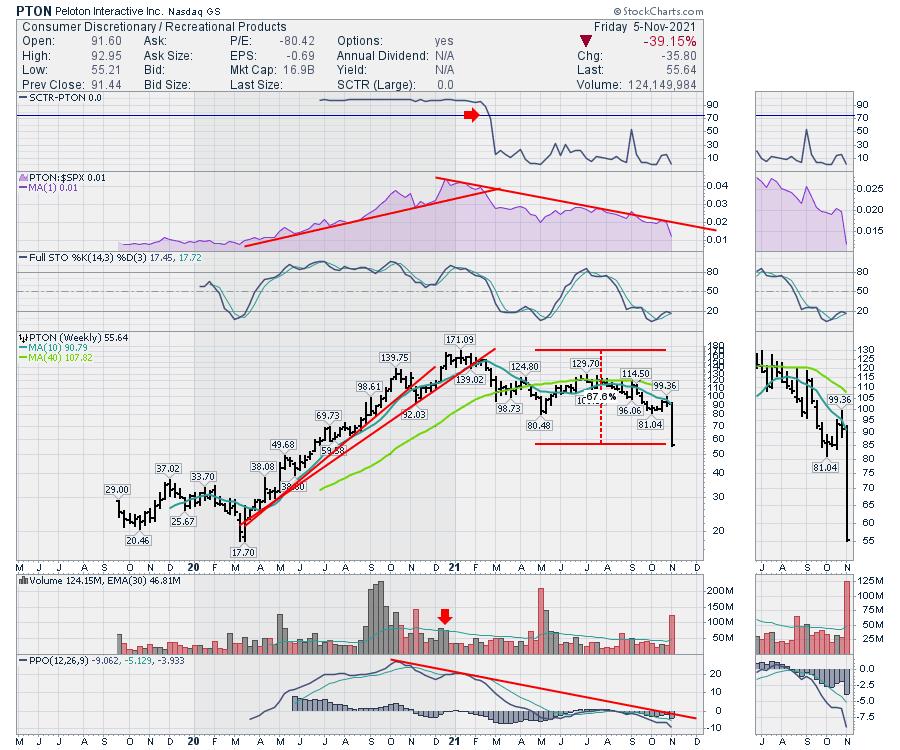
Last year's winner, Peloton has been crushed. The stock is now the example for leaving when the trend ends. But the chart offered all kinds of timely clues. The SCTR ranking is not my favorite sell clue for a strong stock, but clearly, that was a change in trend for a stock market darling. The relative strength compared to the S&P 500 (RS) is one of my favorite sell signals. It is shown in purple on all the charts below. When something that was outperforming, stops outperforming, I have to ask myself why not just leave?
In this example, the PPO momentum indicator put in a significantly lower high on the final peak. That is divergence and it can be a helpful tool to discern weakness. In December 2020, the stock surged for two weeks straight, then stalled. One more attempt at a higher high was made in early January and failed. Notice how low the volume was on the breakout to $171.09. There was no interest showing up and we can see that on the volume scale. The PPO rolled down and it was gone! Volume clues can be a lack of interest or it can be the euphoric exit on screamingly high volume.
Here is another example.
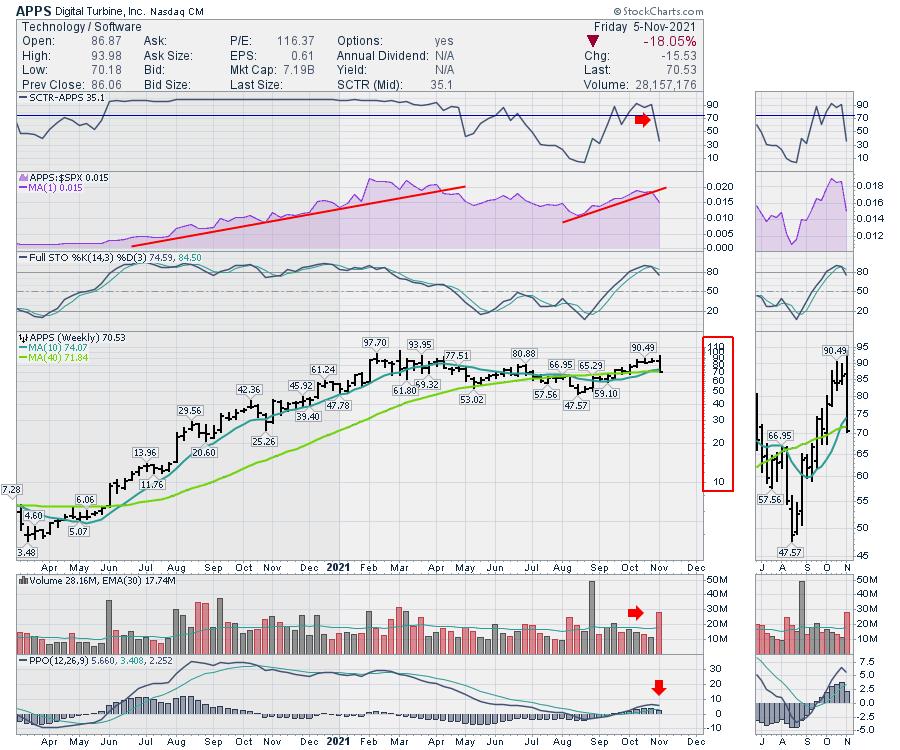
Digital Turbine. Lots of interesting clues on this one, but until it snaps down $20, an investor is not sure if the rally can continue or not. Testing a prior high, this one was just vicious. For me, this is a double top. The weak PPO is a real problem and it is turning down right at zero. I would be fearful here. When the relative strength trend breaks as you test a prior high, that is an important clue that the stock is losing power. This made a fresh six month high this week and immediately turned down. I'd be gone.
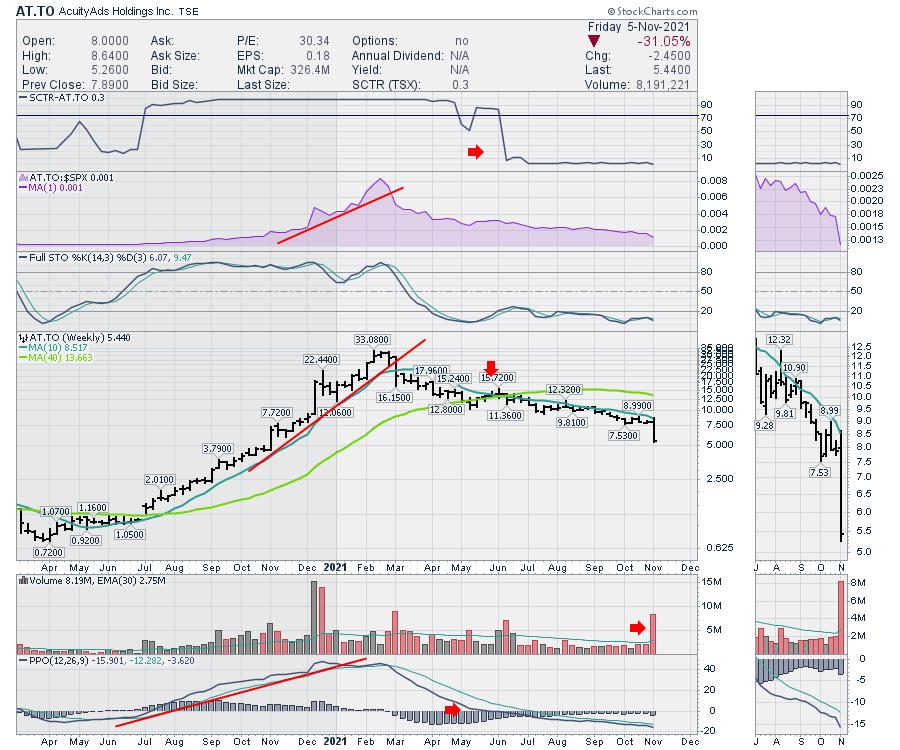
AcuityAds is a Canadian ticker, but the chart had a beautiful uptrend coming out of 2020. When it ended, it was literally time to leave. Other than a few positive blips on the daily chart, it has not given a reason to get back in. Look how long ago some of the signals were in place. The SCTR ranking at the top was so strong, it didn't give a sell signal for three or four months after the peak. SCTR is not my favorite sell signal. It can alert us to relative weakness, but there are many other clues on this chart like the hard breakdown on relative strength (RS) in purple. That signal coincided with a trend line break on price and the PPO momentum indicator weakening.
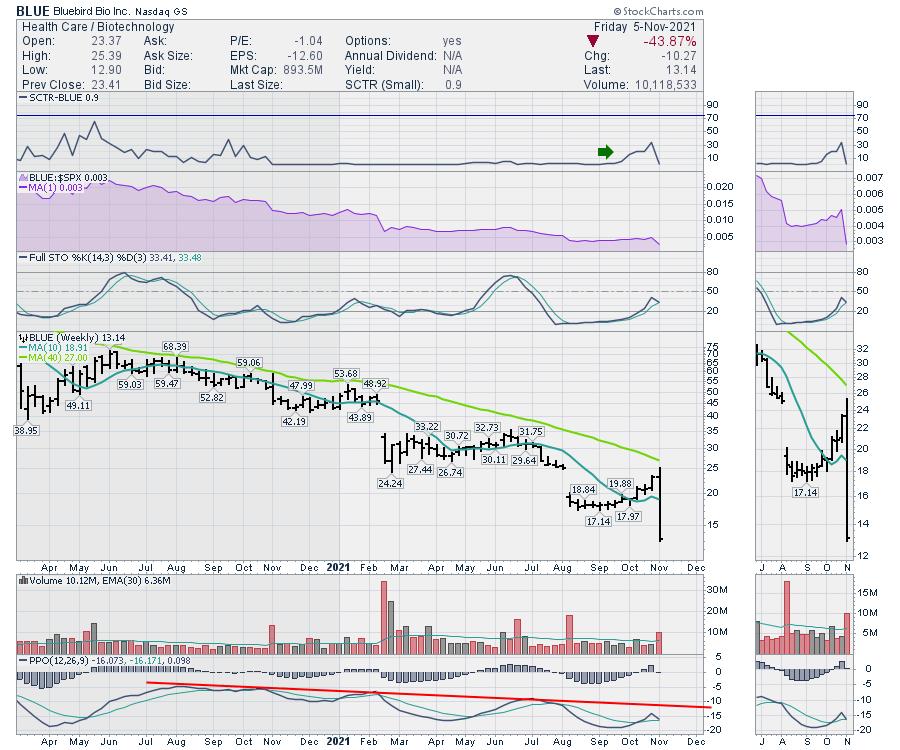
Biotechs are notoriously hard to trade.
Rule number 1: If it isn't in an uptrend, don't touch it.
Bluebird Bio was a name with considerable interest years ago. During the entire stock market run from 2020, this stock has been heading south instead of north. Notice the PPO is still down and out. It has not been above zero (it is in negative territory) on the chart. The PPO indicator is a momentum indicator. Momentum is negative throughout this chart. It has periods of 'respite', which means - 'a short period of rest or relief from something difficult or unpleasant'. Let's just say, anyone owning this got hit hard this week. Bottom fishing in biotech is merciless. This stock had broken the downtrend in price, but just barely.
Which brings me to a couple of names that could be more sensitive right now. BioNTech has been a big part of the world's Covid response. Let's take a minute and review the price action in such a dynamic year.
Interestingly, as the vaccines were approved in November 2020, the stock broke out to a fresh new high, then immediately pulled back. Ouch! December gave you a 30% pullback. The stock started the new year with a rally but stalled under the prior high. In April it finally took off to the upside. After going from $110 to $213 in 5 weeks the stock consolidated. The $213.15 high had a $70 range that week, testing a lot lower, but closing close to unchanged. The stock consolidated for a few weeks, then made a new high for two weeks in June. It rolled down for four weeks after the new high. No one said this was going to be easy.
In the next 5 weeks, BioNTech doubled! This run in July 2021 saw weekly volumes surge way higher than the volumes during a similar surge in June. The volumes were also much larger than the volumes in the April run. The huge volume into the end of July was at least a clue that this was getting very frothy. Three up weeks of volume over 20 million! The volume in the April run, was above normal volume where the average was 12 million and it traded at 18 million. Not remarkably high, but showing buyers are buying the stock. The big volume candle in early September without a corresponding breakout was another clue of a stock failing at high volume. That is easier to tell in hindsight.
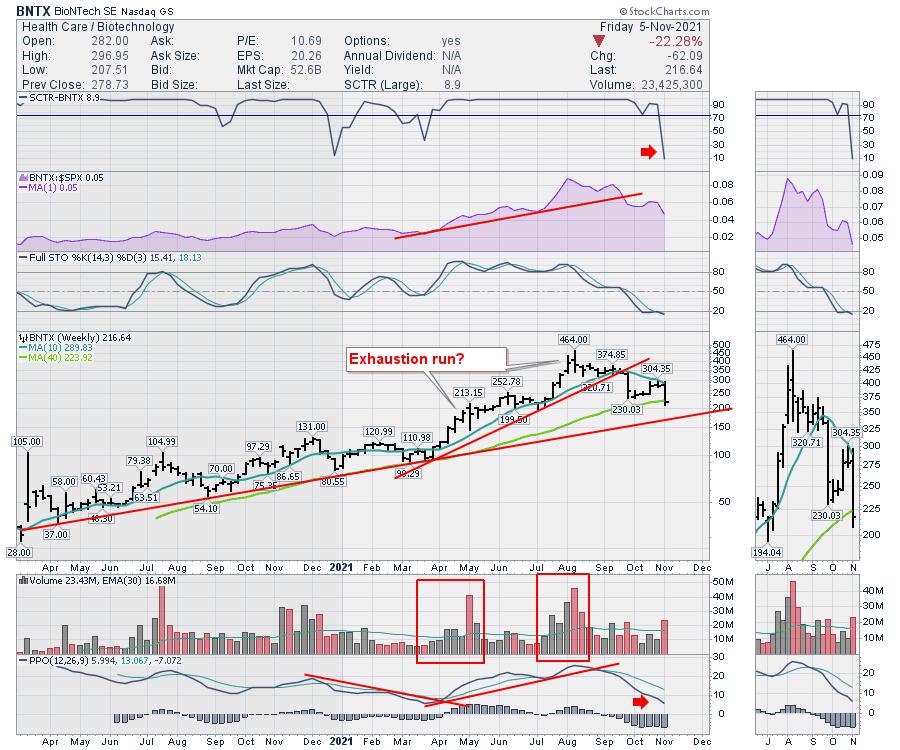
Staying with the chart above, the PPO momentum indicator broke it's downtrend in April as the stock broke out to a new high. The PPO uptrend from April to August was strong and the PPO never gave us a lower high as a final signal like PTON did. For me, the trend line break on the PPO and on the purple RS (relative strength) would have me clamouring for the exits in late August. That would have been difficult even then, because the stock was $100 off the highs so 20% of the gains were already gone! The PPO momentum indicator is at its lowest level on the chart. I would let someone else own it.
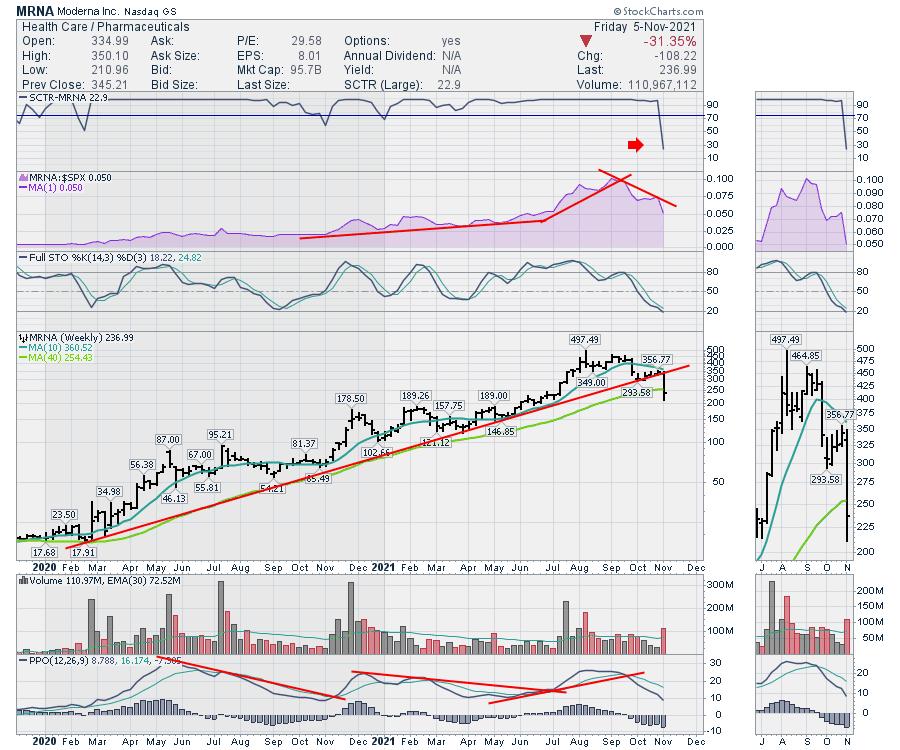
Which brings us to Moderna. First of all, the SCTR, which is always late on strong stocks, is clearly different than at any time during the uptrend. Without looking at the price on the stock chart, there is a huge change in the relative strength on the chart. After a remarkable surge through July, I'd be looking to get my relative strength trend line on there. Once broken, I'd be out. The stock is up to $500 from $23. If I am looking to find an exit, and I should be after a parabolic run, the break in relative strength would be it.
Moving down to price, The stock price migrated sideways from early August to late September. In mid September, the RS line broke. The PPO trend line broke. If nothing else, I would need to have a stop so it wouldn't take any more gains away. One fundamental trader, who is on TV, has been buying the pullbacks in his favorite stock. It's his favorite and largest position because of the up ramp it has been on. Technically, the chart is broken in my opinion and the price bar this week wiped out 30% of the value. The fundamental data won't catch up with this stock price action any time soon. But investors are voting with their wallets. They are selling, while others are buying the stock based on the story.
I have a list of 40 stocks this week that got crushed while the indexes roared higher. There is a clue there. Most of the stocks were in downtrends already, but some of these are still close to their peak. If you are looking for more ideas on how to keep the profits you have in big winners, you are not alone. I answered multiple phone calls this week from investors trying to figure out how to sell better.
So the title of the article is: There Are Exit Signs at Costco. The point of the article is that we need something to help get out of a strong stock, before we lose the gains. This is not about the Costco stock, just to make sure. It is about having a technical exit signal for trading.
If you would like to join my newsletter service, you can try it free for two weeks at gregschnell.com/explore. It contains education, where to hunt, where to avoid, when to hunt, when to golf. Give it a try and see if you find value.
Good trading,
Greg Schnell, CMT, MFTA
Senior Technical Analyst, StockCharts.com
Author, Stock Charts For Dummies
Want to stay on top of the market's latest intermarket signals?
– Follow @SchnellInvestor on Twitter
– Connect with Greg on LinkedIn
– Subscribe to The Canadian Technician
– Email at info@gregschnell.com


