In one of the greatest stock rallies ever, 2021 will go up in history as an easy market to make money. The chart opened on the lows, closed on the highs and never had a 10% pullback. What could be easier?
For all charts below, the scale on the left is in percent gain, while the scale on the right is the actual price currently.
The Nasdaq 100 (QQQ) was also a strong chart.

Across different mediums, chatting with friends, family, clients and traders, this year had one of the wildest results, oddly. Hedge funds, overall, didn't do too well. They were too pessimistic. If they held short positions to smooth out the trend, they got killed.
Retail investors who had professional portfolio managers were up 25%, which is an awesome return. This is the median return.

Tech investors had a wild year. The XLK looks smooth, but varying areas of tech were all over the map.

What worked great last year got killed this year. Peloton (PTON) and Zoom (ZM) were hard hit.

The Nasdaq kept climbing, and it was led by large-cap tech. I saw some chart crime out there, where chartists failed in using the right parameters to compare two different charts.
The background is different so you realize this is a different scale for this chart. This is XLK (red) in percent gain where, the bigger the company value, the larger the weight. The second chart line is RYT (black) in percent gain, which gives each company the same weight. The third line is RYT (green) price.
In this example, I have used percentage scale on the right, which shows the XLK outperforming the equal weight by 20% (36% compared to 30%). The green line is the price of RYT and it gets stretched to look the same as XLK. Make sure to compare percentage returns, not chart shapes! If I just put both charts on a regular chart, the computer will stretch both charts to reach the bottom and the top.
I want to explain this, because this chart is floating around Twitter saying the XLK performed the same as RYT. Compare the red and black (both percent charts), not the green one.

For the first time in a while, energy traders had a good year. The more conviction, the higher the profits. Heading out of the year with a 75% gain!

Gold investors watched as the world passed them by.

Industrial metals investors did pretty well. Copper was in line with the average portfolio.

Agricultural commodities had a great year.

I read a Twitter thread with traders talking about what they could have done better. What I found interesting was that, even though energy was a top performer, the traders couldn't leave the tried and true. They got stuck in SPAC mania, they got stuck in biotech, they got stuck in electric vehicles, they got stuck in payment systems, they got stuck in renewable energy, they got stuck in vaccine names. Here are some of the charts.
IPO shows the new listings. SPAC's were a big part of this. Note the drop from February SPAC-mania.

Biotech (IBB):

Electric Vehicles like NKLA hurt investors.

Lucid (LCID) was one of the better ones, depending on your entry.

Paypal (PYPL):

Renewable Energy:

Lastly, Moderna (MRNA). Depending on your entry, it could have been great. But your exit was important too. Even though COVID/Omicron is raging, the stock can't rally. Giving back 50% since August is hard.

It wasn't all bad. Semiconductors continued to deliver. NVDA was great! Lots of names just hit new highs.

I do want to conclude by saying it has been a massive run since the lows of 2020.
140% for the Nasdaq 100:

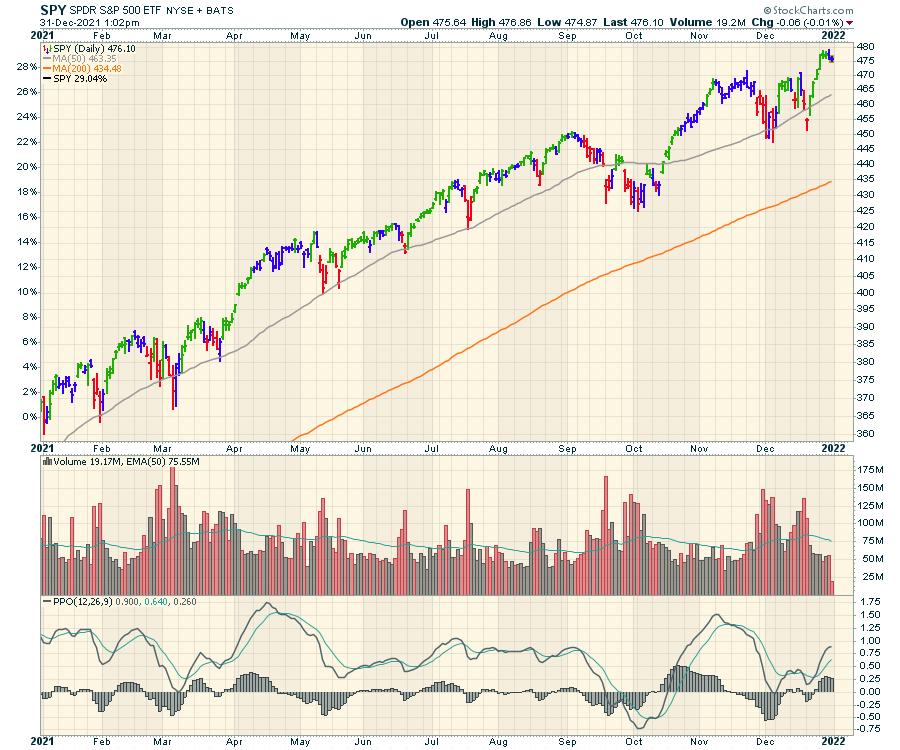
115% for the SPY:

Through it all, it has been a huge run. Hopefully your portfolio has been enriched!
That's a wrap on 2021. Best wishes for a great year ahead!
Good trading,
Greg Schnell, CMT, MFTA
Senior Technical Analyst, StockCharts.com
Author, Stock Charts For Dummies
Want to stay on top of the market's latest intermarket signals?
– Follow @SchnellInvestor on Twitter
– Connect with Greg on LinkedIn
– Subscribe to The Canadian Technician
– Email at info@gregschnell.com


