After a rough January, investors are on watch for a much better trading environment in February. We've had a few storytime illnesses hit in January.
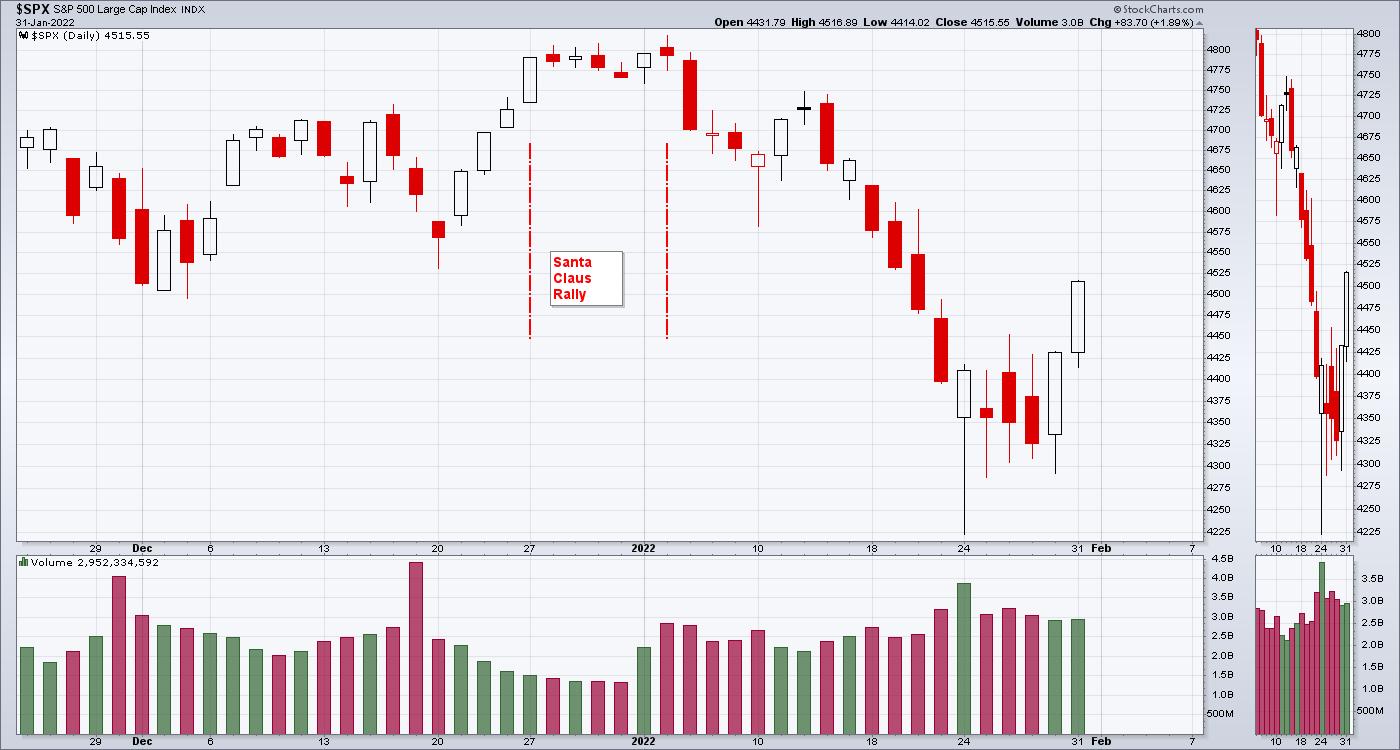
Remember the Santa Claus Rally? Last 5 days of December and the first two of January? Well, the $SPX topped on January 4th intraday and plummeted for the month. The market did rally for Santa Claus, and it was supposed to be a sign of more upside. A closer look shows 2 days actually made the gain.
Another discussion revolved around how the market does after a great year. The storytelling around the history of the market when the previous year was up big was that the next year was bullish. The market trends so we'll have another great year in 2022. A big down January makes that a hard start.
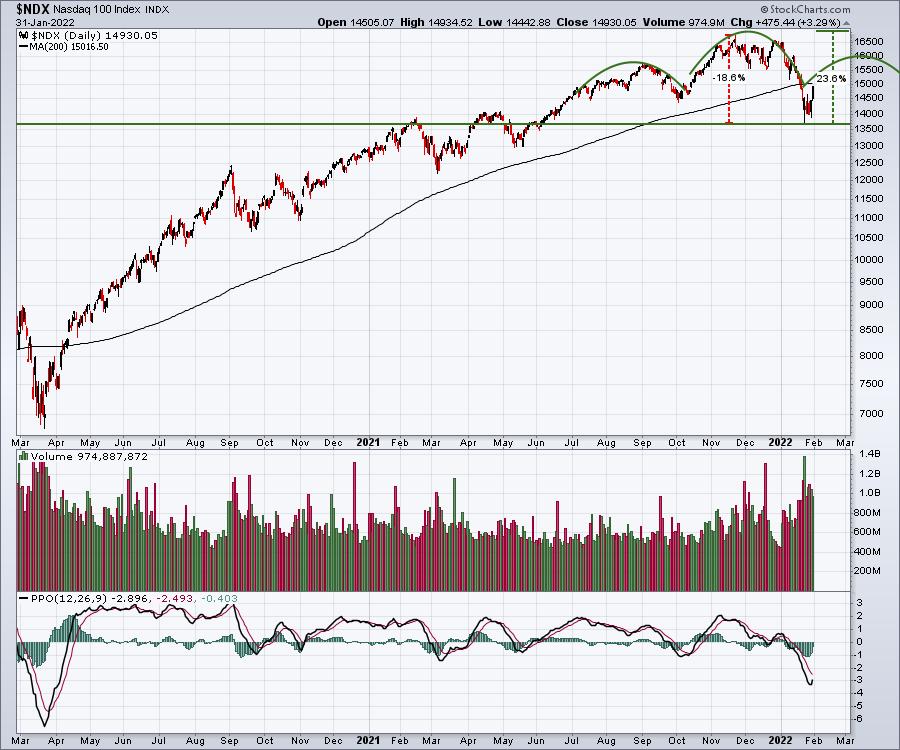
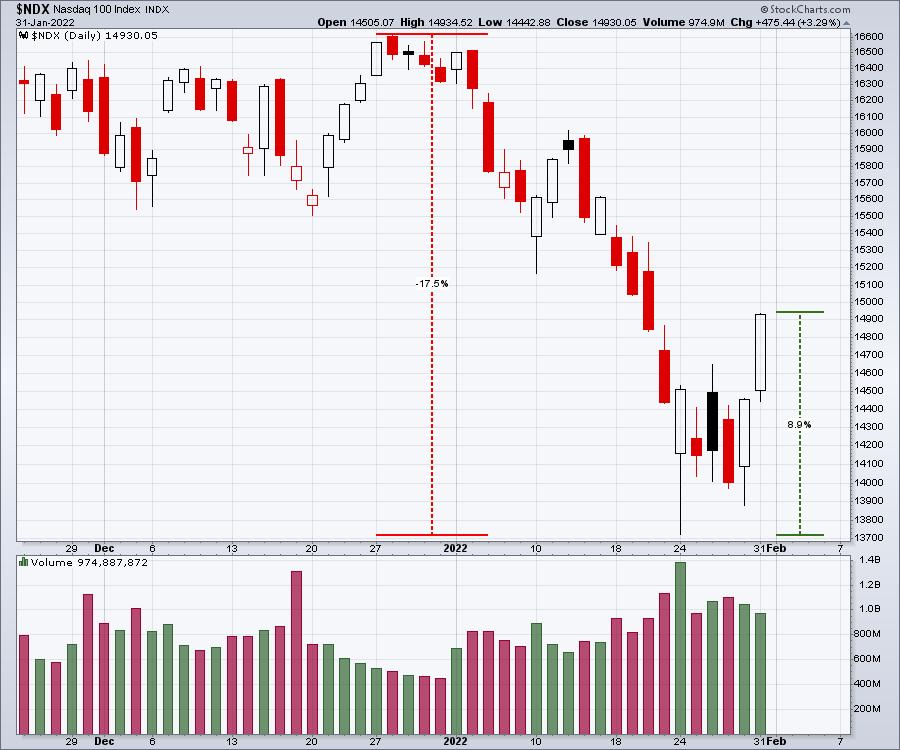
The Nasdaq started off with a drop of 18% and will need a rise of 22% to get back to the prior high. More importantly, to go green on the year, it will need to move up 19% off the lows of January. That is a pretty big headwind to start with.
As the storytelling continues, if January was an up month, the year will usually be up. That comes from a piece of logic that, if the market is continuing higher in January, bullishness should continue. Well, January price action was the worst January since (the media picks a year for commentary - January 2008, January 2009, January 2018, January 2016) x-date to create reference commentary. It was also the worst month since the drop in March 2020. Well, April 2020 was up huge and we went on a 120% gain after that. Is that what is next, or is the rest of the year a write-off because of a down January?
Importantly, the rally that started on Friday morning has already moved up 1/2 of the drop from late December. Another 10% rise and we'll be back to where we started. Friday and Monday were big bounces on high volume, suggesting buyers are showing up.
Who knows what the next story tale is if the last day of January and the first day of February are up?
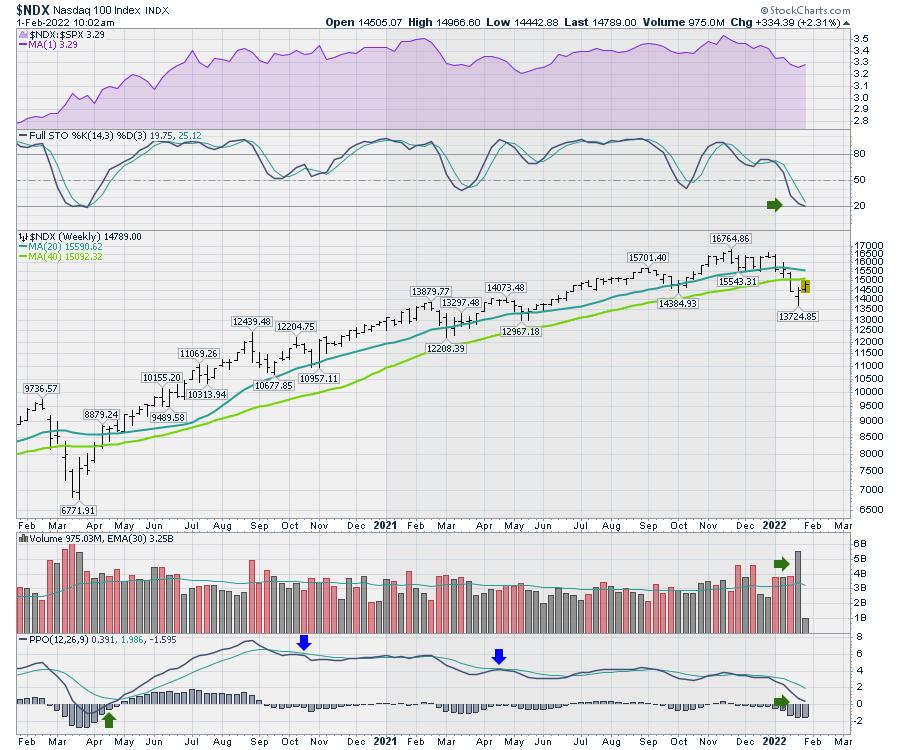
The longer-term charts present a view of a market with less momentum. The 200-day moving average is shown in green.
The next question is: Will the green line, which was support for the rally all the way up, now be resistance? That is what traders have to worry about.
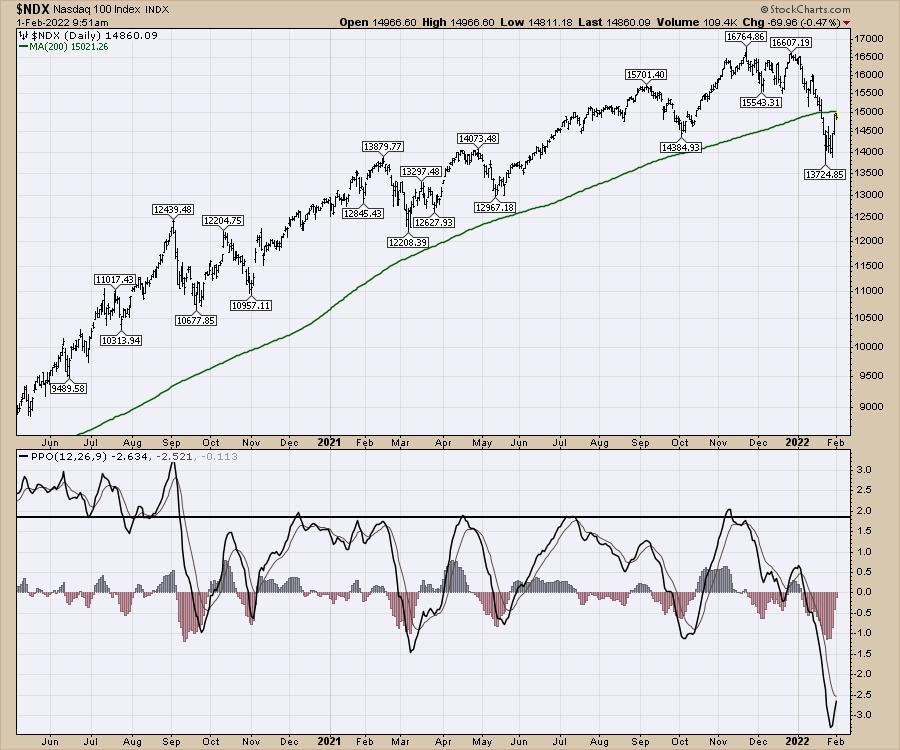
On the Nasdaq weekly chart below, the full stochastic indicator is trying to bounce at zero. That is a good place to look to get long. The bottom indicator is the PPO indicator. I like it when it resets at zero and starts to rise up, and that would appear to be what it is doing! However, on the price chart, the 20-week moving average is now pointed down, and price has retraced back to levels first seen in June 2021. The chart also presents this as the first lower low of significance on the chart. Downtrends are when we make lower lows and lower highs. The next high becomes a very important data point for technicians.
When the market was making higher highs and investors continued to make more money, no one was worried. All of the people who bought in the last six months will be getting anxious to lock in profits or smaller losses, which provides resistance to the move up.
The last low (COVID in 2020), received both Federal and fiscal support worldwide. The exact opposite is happening now. As we don't have a lot of history on this situation, it is clear that liquidity has helped fund a rally of epic proportions and that liquidity is leaving. The area of the September high around 15700 is an important area to respect. From a technicians' point of view, this rally should be swift. It may also be swift both ways, getting everyone bullish only to revert and move lower.
Most investors from the last 10 years have had no real experience with prolonged bear markets. At this point, we don't know if this will be one either.
The monthly chart shows a different picture. Momentum is rolling over on the PPO indicator after a 20-month run. The PPO suggests this was one of the frothiest runs in the history of the Nasdaq. I have written extensively on this since November.
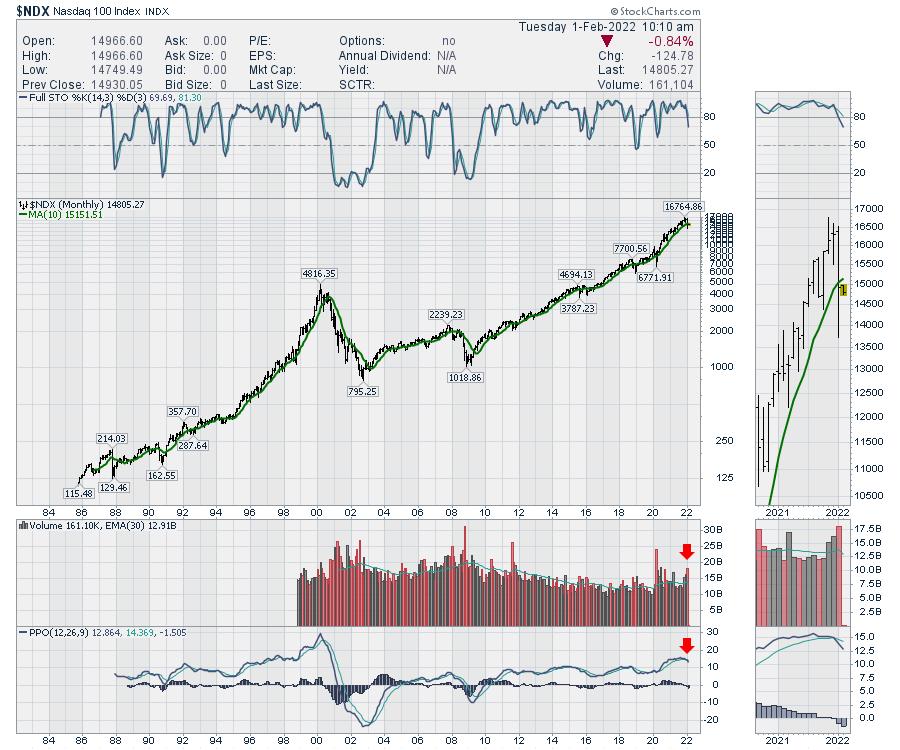
What does it all mean? In the big picture (monthly), we are losing momentum. On the shorter timeframes, we are due for a bounce. The history on monthly downtrending momentum indicators is bearish. On the short and intermediate terms, we are getting a bounce until proven wrong. The Nasdaq Composite monthly chart gave a sell signal at the end of December and it was a good signal to respect.
February will be a harder month, with the potential for the market to turn down under the down-sloping 20-week moving average on the weekly charts. That's a technician's view of why this market will be hard to trade in the coming weeks. Remain optimistic, but don't be afraid to take small losses. Many of the stocks are already down 50% off their highs. A bear market shows up when people start selling the rest of their winners and hold their losers to pay margin calls and taxes.
Good trading,
Greg Schnell, CMT, MFTA
Senior Technical Analyst, StockCharts.com
Author, Stock Charts For Dummies
Want to stay on top of the market's latest intermarket signals?
– Follow @SchnellInvestor on Twitter
– Connect with Greg on LinkedIn
– Subscribe to The Canadian Technician
– Email at info@gregschnell.com


