The lows were put in on January 24th, and we continue to make higher lows coming out of the base. I must admit it is a rather tentative market for the large-cap tech names.
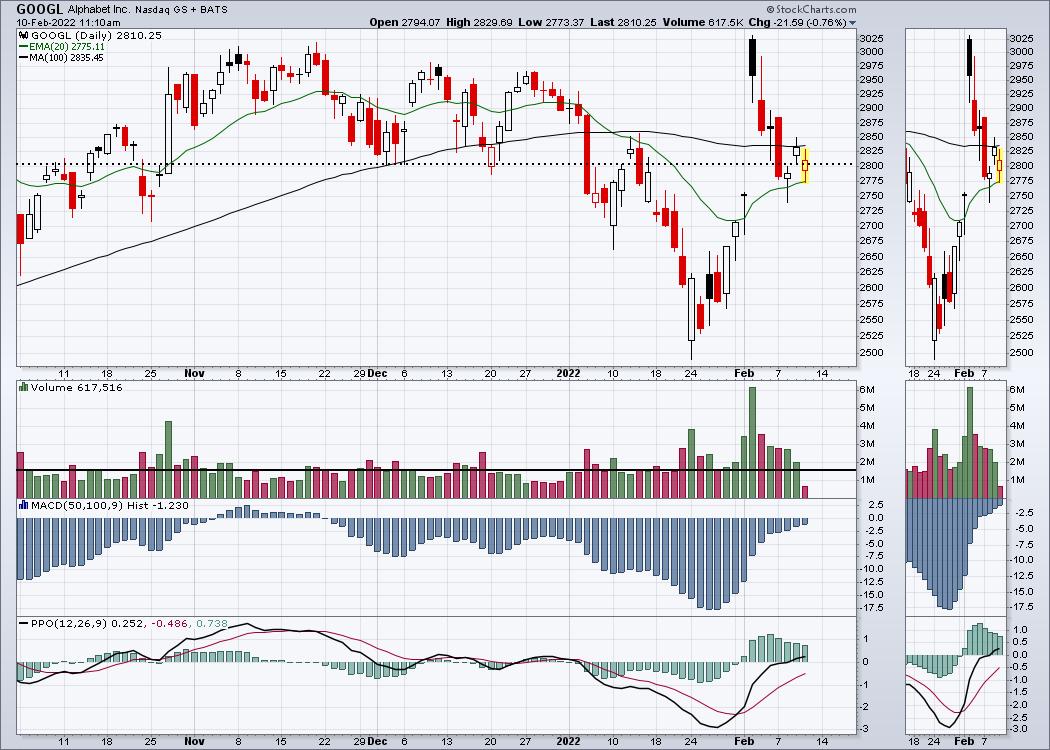
First of all, one chart I am watching is GOOGL, which I bought on the pullback after the earnings release. It has pulled back and currently sits on support. I would say there does not seem to be an upward bias after the pullback yet, but it is still trading on above-average volume. Is that because of institutions selling into the flow or buying the stock below prior highs? It's hard for above-average volume to be retail, but we've seen that in meme stocks, so we can't write that idea off. For now, the stock is trapped between the 20- and 100-DMA lines.
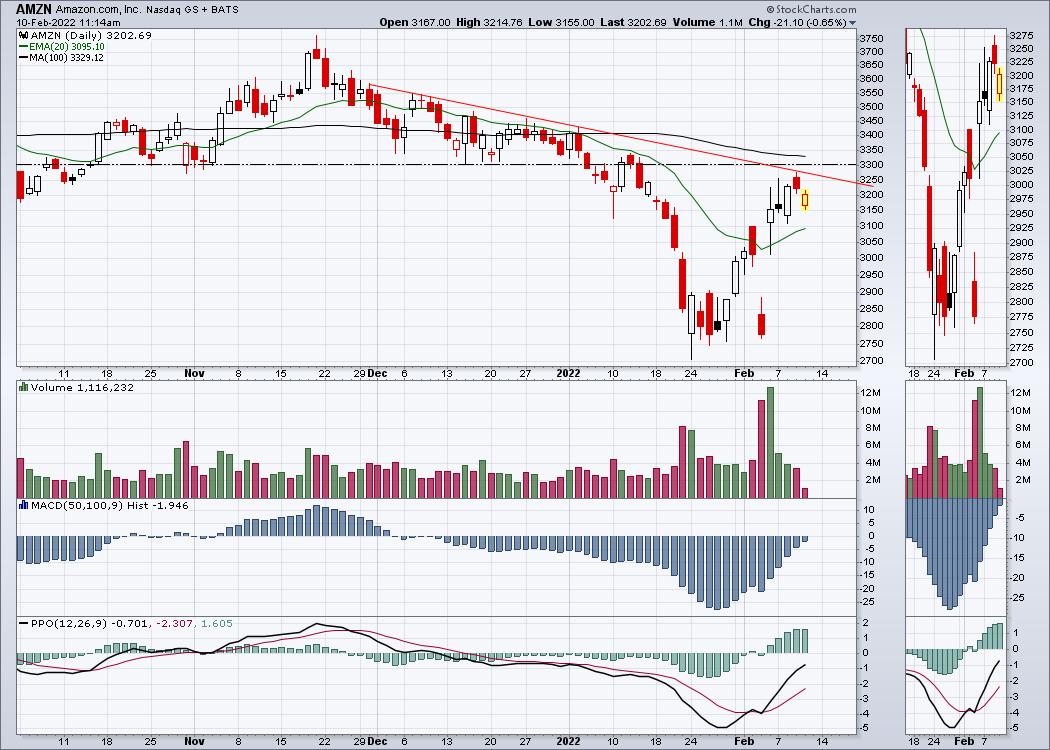
Amazon (AMZN) also had a great earnings report, but it too has leveled off. No real progress in the last five days and the stock has stalled at the downtrend line, as well as horizontal resistance, shown in black. Volume is still bigger for the week than the range in November and December. It is also stuck between the moving averages.
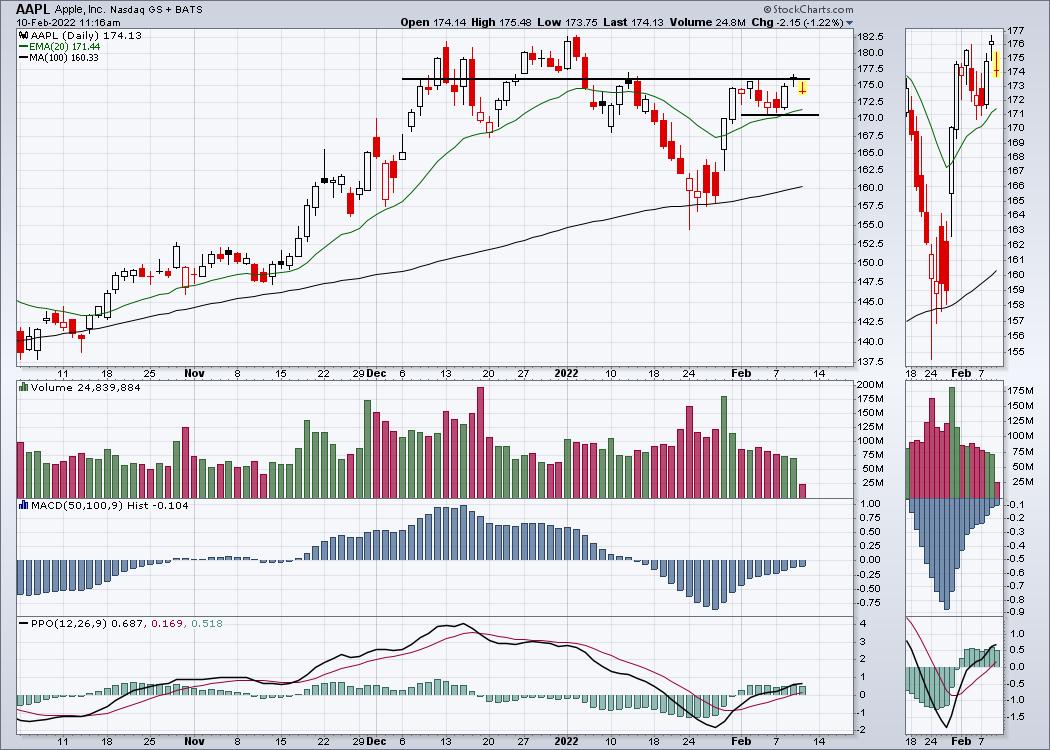
Apple (AAPL), the Wall Street Wonder, is also stalling here. No real progress in two weeks and stuck below the lower high in January. It is above both moving average lines, so that is bullish.
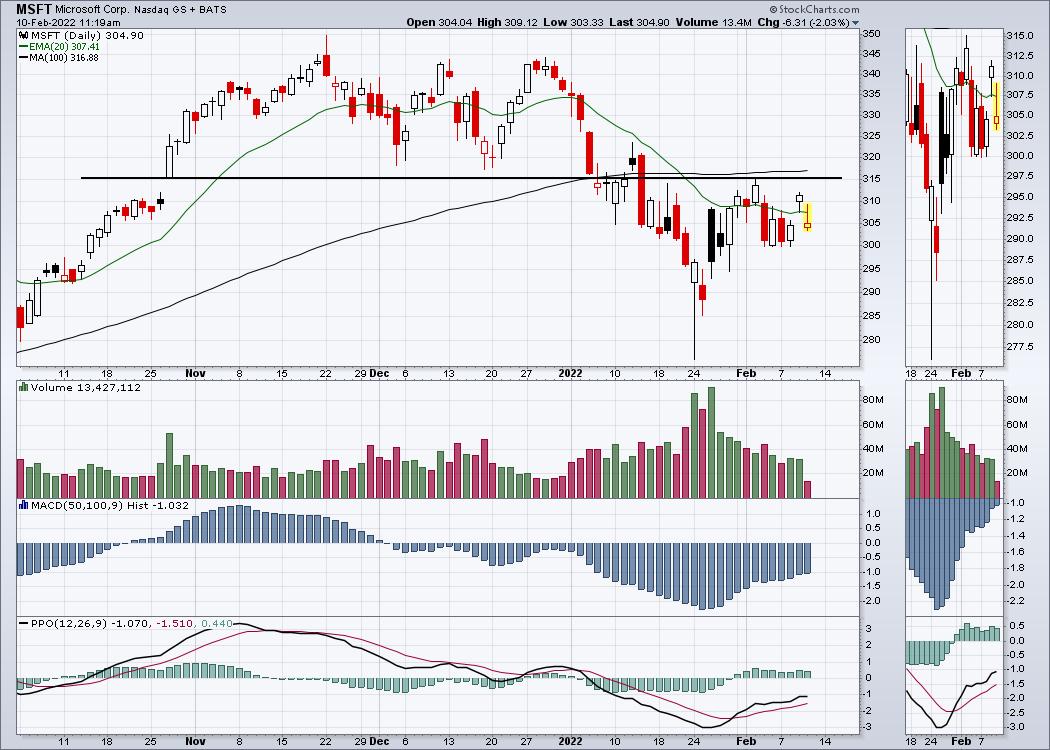
Looking in on Microsoft (MSFT), the chart also has some hurdles to overcome. The price action is oscillating around the 20-DMA, but is holding below the 100-DMA. For a leadership stock, it's not doing much leading as it struggles below the support/resistance line.
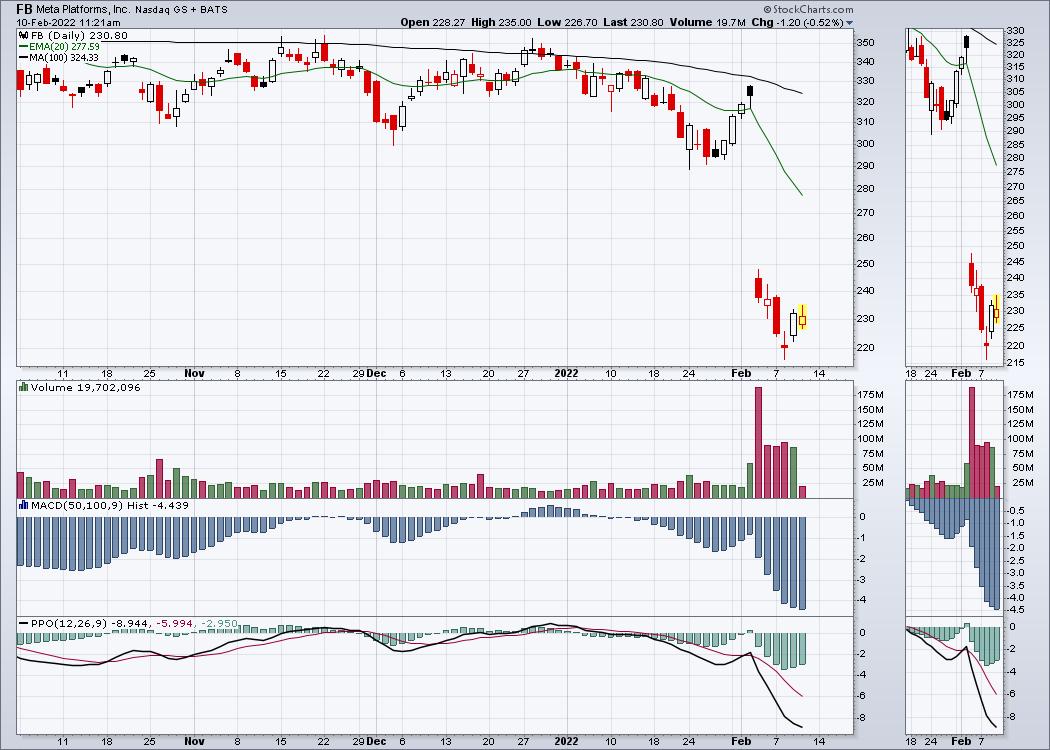
Meta (FB) continues to be a disaster. It is trying to stabilize after the largest single-day market cap loss in history.
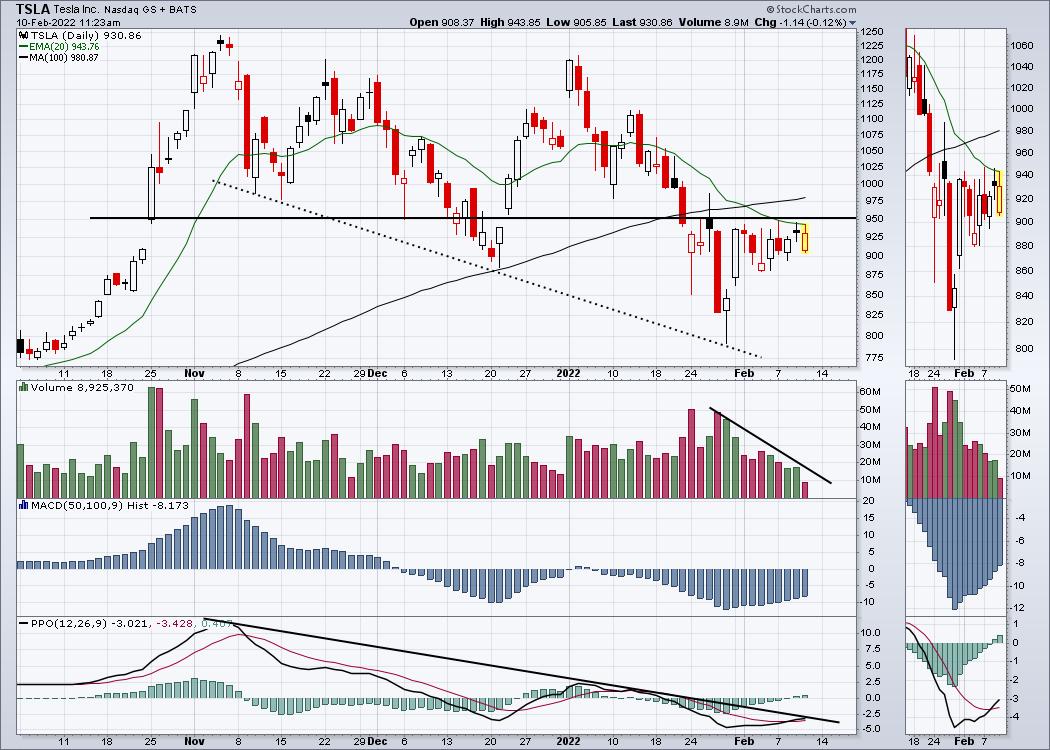
That leaves the golden child Tesla (TSLA). The stock is in a messy situation; it is stuck below both moving averages and hasn't been able to make any progress above the support/resistance line. There is still a trend of lower lows in place and the stock continues to trade in a tight range for the last two weeks.
When I look across the group, I am definitely not inspired to think that this market is ready to go higher, as these stocks make up 50% of the Nasdaq 100. As these stocks wobble, it makes me worry that they are being sold here, not bought.
Good trading,
Greg Schnell, CMT, MFTA
Senior Technical Analyst, StockCharts.com
Author, Stock Charts For Dummies
Want to stay on top of the market's latest intermarket signals?
– Follow @SchnellInvestor on Twitter
– Connect with Greg on LinkedIn
– Subscribe to The Canadian Technician
– Email at info@gregschnell.com


