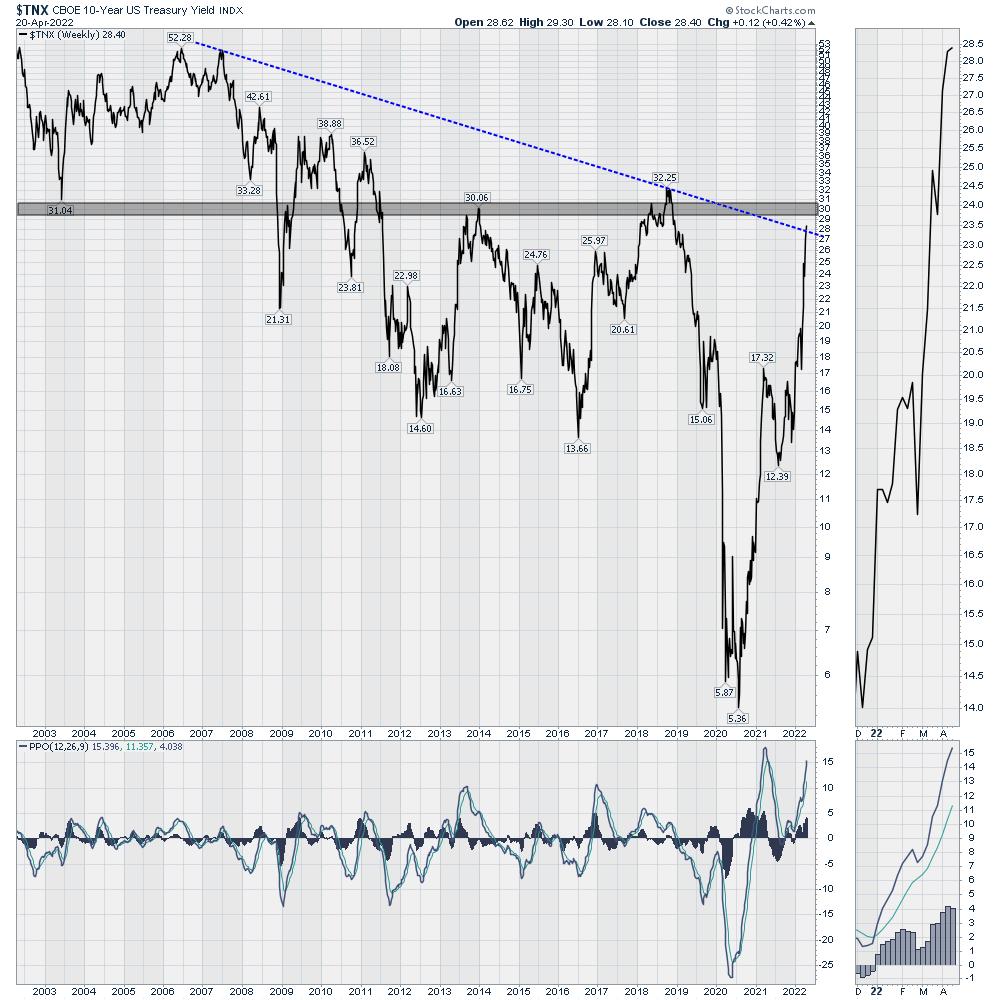
The bond market has been a house of pain as yields moved higher. This week, the 10-year is testing the downtrend line from the infamous top in 2007 before the start of the Great Financial Crisis. This is also close to the zone around 3% that has been friction/upside resistance for the 10-year over the last 10 years.
As the yield curve compressed, the bank stocks have also struggled. I have used JPM below as an example. The chart looks weak, but there is a little bit of enthusiasm on it. Can you spot the positive point?
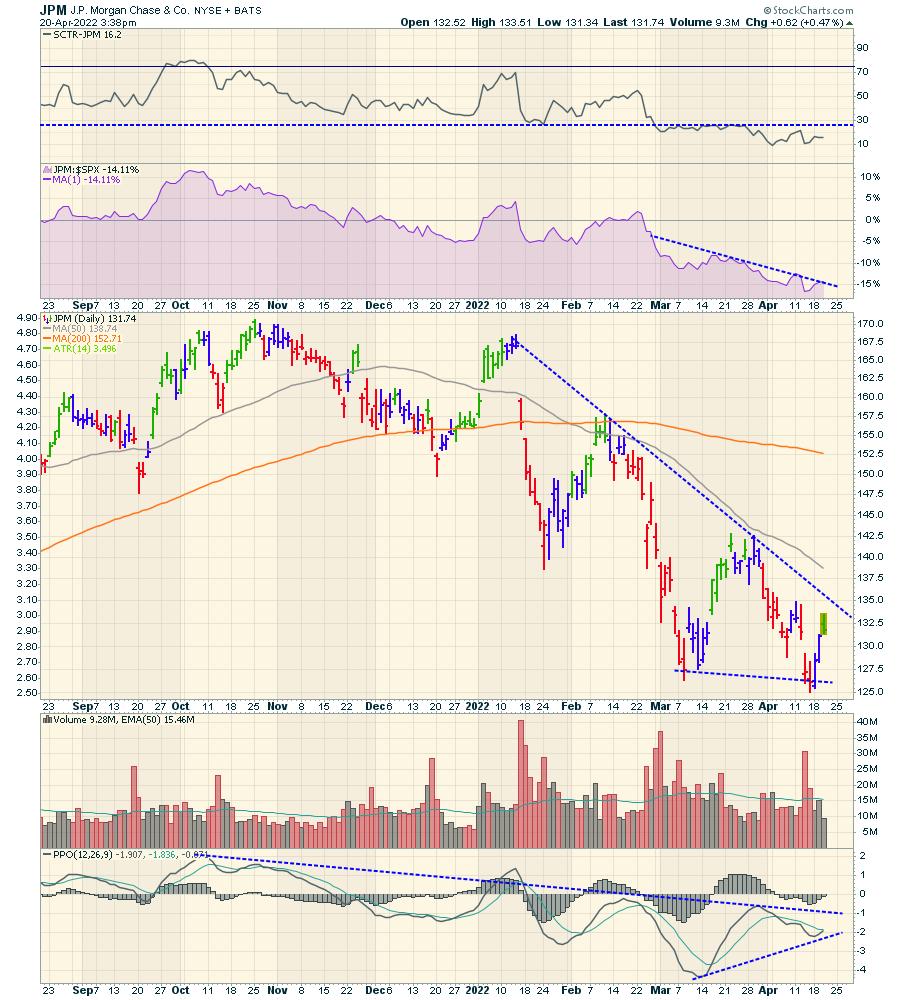
JPM has the potential for an interesting change in momentum here. Momentum is displayed on the PPO. This would be the first higher low on the PPO if it can turn up and cross the signal line here. It would also come close to breaking the long downtrend in momentum peaks on the PPO that began in October, if it can climb a little higher.
Lots of talking heads are talking about the yields stalling out here, as they have done for the last 10 years. Now that the debate is front and centre, we'll watch to see if the huge momentum in yields stops here or continues higher. If it can stall here, it might give the bank stocks a relief rally from the yield curve squeeze. JPM is trading above the level it was at before the earnings release last week.
Japan
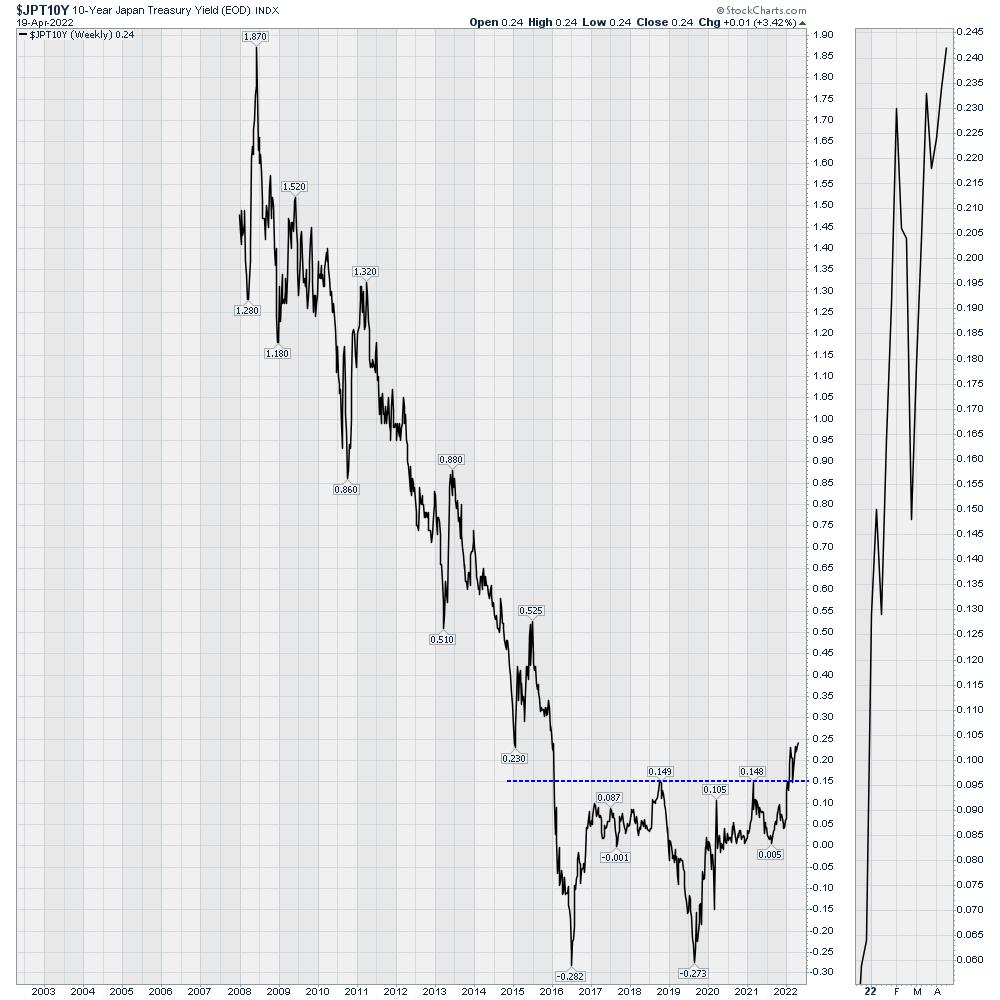
One bond chart that has broken through resistance is the Japanese 10-Year bond. Normally, this wouldn't make it to the coffee table for discussion for general investors, but there is a reason it should. Japan has an enormous amount of debt. It has the worst debt-to-GDP ratio in the world. The country has some of the weakest demographics in the world. This series of islands sits geographically near Russia and China at the apex in the hotbed of global politics. Almost all their energy is imported, and this is getting more expensive as oil and natgas prices rise. The Yen has lost 12% over a few months, making all the energy even more expensive (not shown).
Now that the Japanese 10-year yields have broken through the resistance zone at 0.25%, will this continue to soar meaningfully? If the global interest rates were to rise significantly, this could add significant pressure to the JCB's ability to control the yield in this bond market. As the JCB has been buying their own bonds, it wasn't in focus. The sudden impulse of inflation has served up a significant test for the country of Japan and the G7.
Systemic problems are never obvious at the front end, but now the global liquidity is also being drained. The charts are starting to point out differences that were not in view before. The sudden move on this chart is a big problem for a G7 nation. While the US yield curve pauses at resistance, it might be global risk that starts affecting it even more.
The bond markets are an important area to watch. If the Japan situation gets more out of control for the Japanese Central Bank, we could see things go wild. Conversely, if the US bond market can stop rising at resistance here, that might bring a little relief to these sagging bank names.
Good trading,
Greg Schnell, CMT, MFTA
Senior Technical Analyst, StockCharts.com
Author, Stock Charts For Dummies
Want to stay on top of the market's latest intermarket signals?
– Follow @SchnellInvestor on Twitter
– Connect with Greg on LinkedIn
– Subscribe to The Canadian Technician
– Email at info@gregschnell.com


