At Osprey Strategic, the main goal is to help clients avoid downside risk while learning to secure more profits. Our proprietary momentum scan system searches for abnormal volatility, which flags the urgency of buyers. It was designed to signal the potential of momentum coming into an underlying name or sector.
Normally, I, Greg Schnell, write the articles that appear on StockCharts.com. I have written on StockCharts for over 10 years now. Since I formed our new company OspreyStrategic.org, I also have Dwight Galusha working with me.
I'd like to take this opportunity to introduce the clients of StockCharts to Dwight. After reviewing his quality of work below, you'll see why he is such a valuable contributor to our clients investing in the markets. He compiled these stocks below for our subscribers, and I wanted to share the type of timely information Dwight sends out and our clients look forward to the setups every day.
Here is a little more information on Dwight and the article he penned today.
Hi. I'm Dwight Galusha, CMT, and I am a Technical Analyst at OspreyStrategic.org. I am focused on US and Canadian equities, using a systematic approach of identifying momentum and finding signals within a trend. I've teamed up with Greg Schnell on this project where, each day, I complete a series of daily setups for our subscribers.
Today, I'm going to be focusing on a sector that is not only showing an acceleration in upside price momentum, but is also breaking out in relative strength. The relative strength indicator is just a simple ratio chart of a stock divided by a benchmark, such as the S&P 500, that signals outperformance. When the line is rising, the stock is moving up faster than the benchmark chosen. This indicator is an important tool for identifying opportunities. More importantly, during times of market volatility that we are experiencing right now, the relative strength indicator can be used to find pockets of strength. Since most fund managers need to outperform the benchmark, money tends to flow into sectors and industries showing outperformance. When that benchmark is struggling with very few sectors showing strength, it's helpful to graphically see a sector breaking out to new multi-year highs. The top panel on the charts below visualize relative strength.
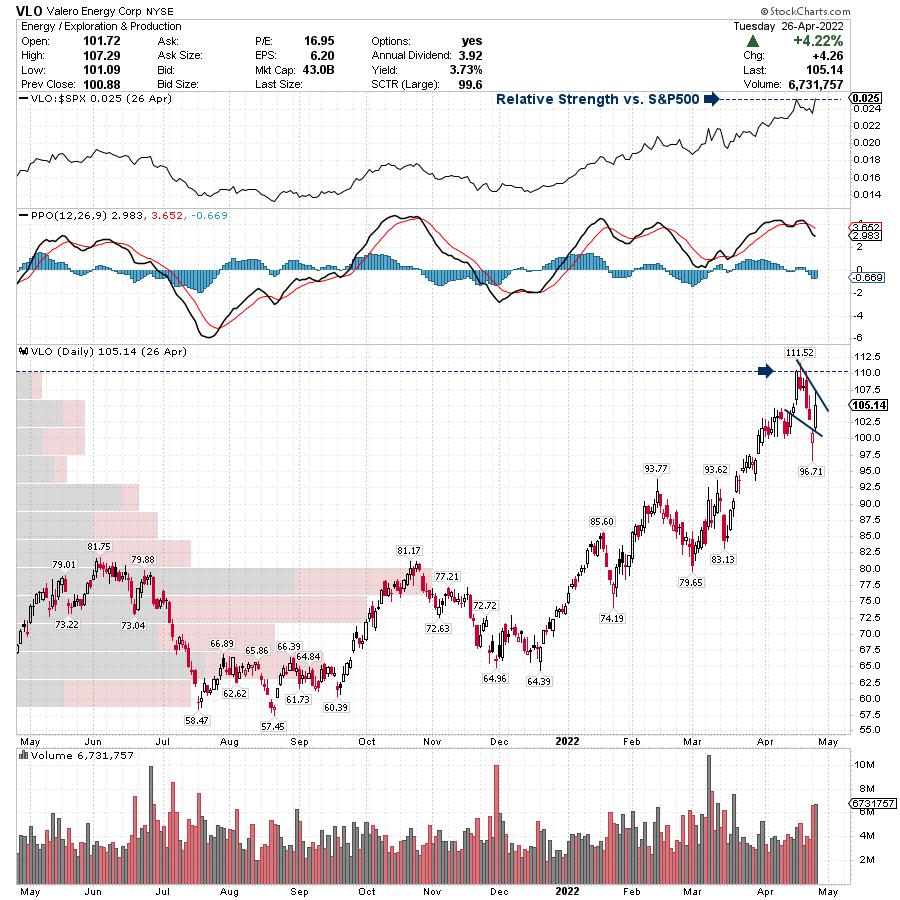
Valero Energy (VLO) was a chart that I highlighted to our readers on April 26, 2022, when price was at $105.14 and threatening a new all-time high breakout. Take note of how the relative strength indicator was pushing to a 52-week high (signalling outperformance) while price action was setting up within the bull flag continuation pattern.
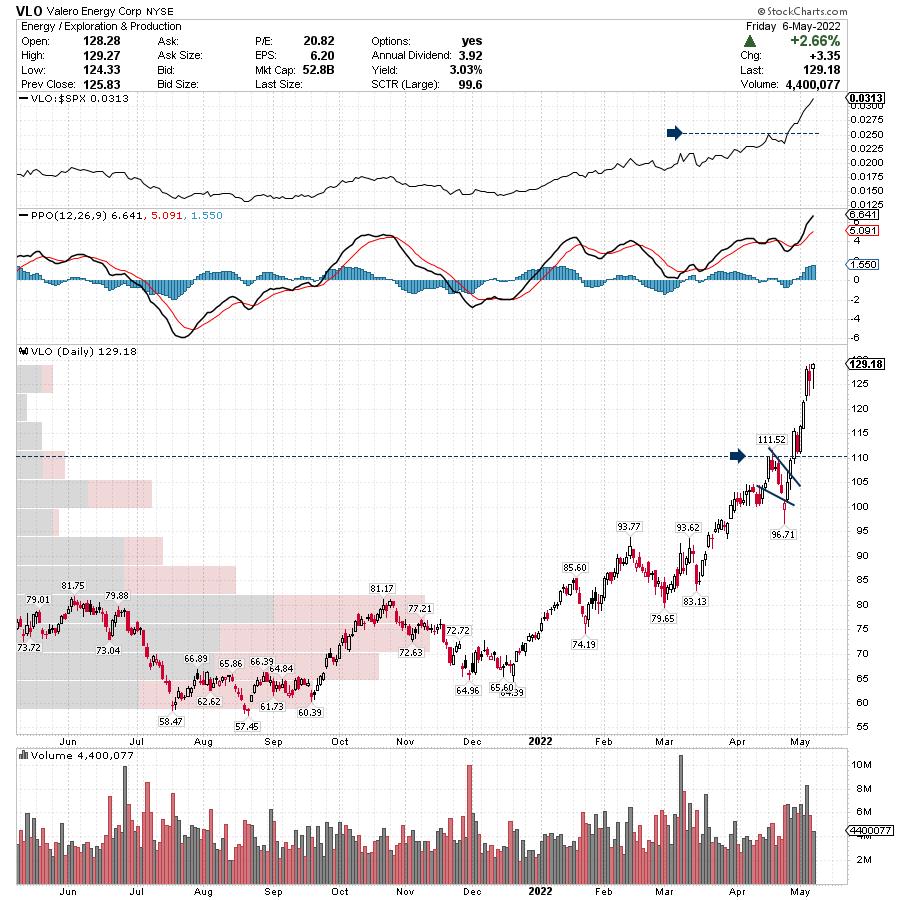
Since then, price action went on to surge $24.04 or 22.9% in 8 days. This is a stock chart that we are still monitoring for further upside momentum.
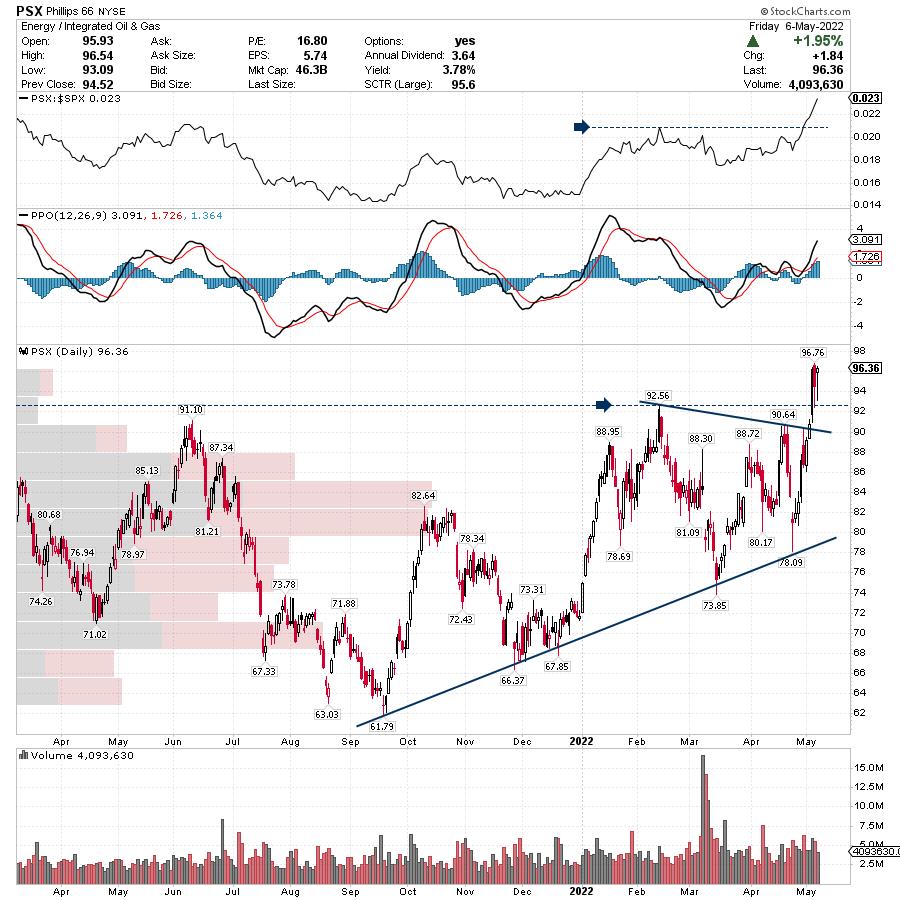
Phillips 66 (PSX) is a chart that started to appear in the momentum scans on April 18, 2022, and is a name that we've been talking about in the Osprey Strategic workspace ever since. On May 5, 2022, I featured Philips 66 again in the Daily Setups, as price action started to breakout to a multi-year high while the relative strength indicator started to accelerate higher. This technical breakout is bullish and suggests further upside momentum to follow.
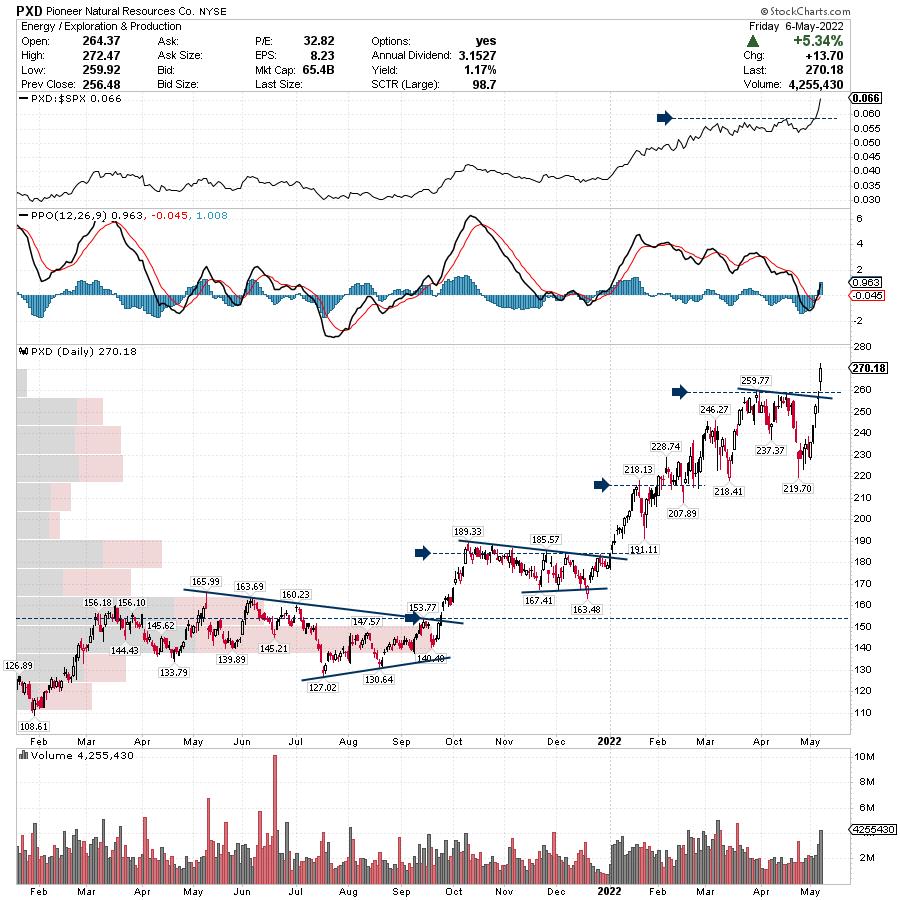
Pioneer Natural Resources (PXD) is a chart I first highlighted in the Daily Setups on September 24, 2021, when price action was at $162.03 and threatening to breakout from a multi-month consolidation / continuation pattern. I suggested a stop-loss order could be placed at the $146.40 price label in case of market failure.
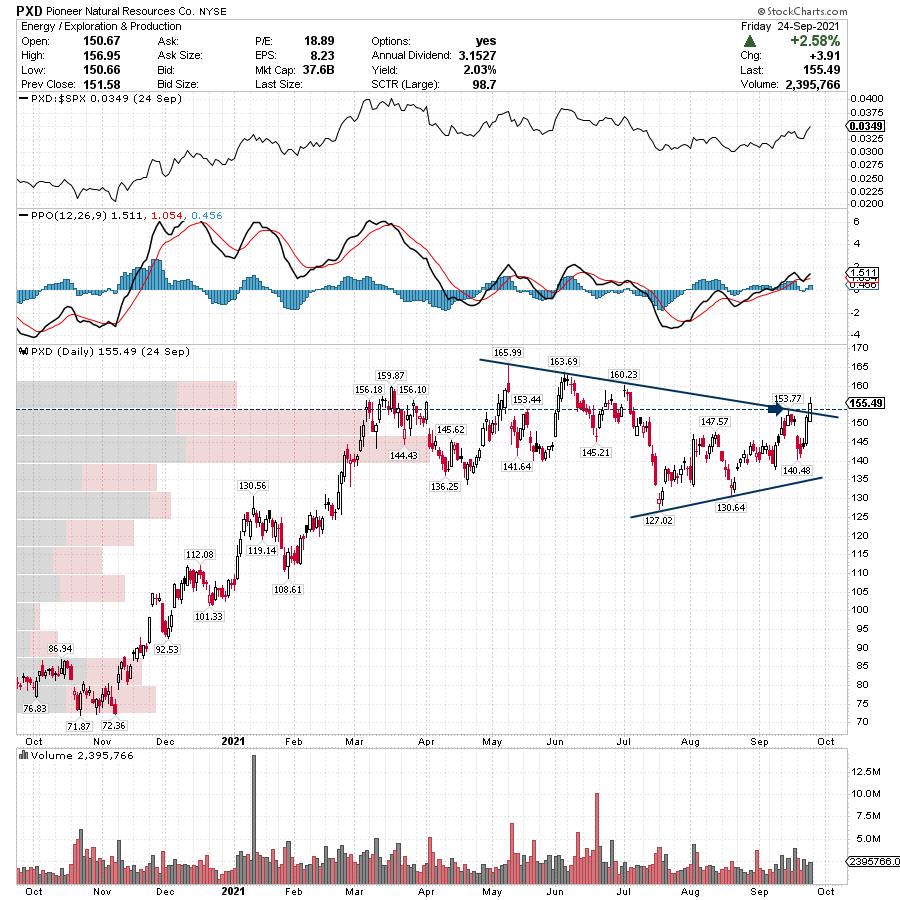
Since then, price action went on to surge $108.15, approximately 67%. Many more signals were highlighted in the Daily Setups during that uptrend. The most recent was this past Thursday, when I alerted our readers to watch for a breakout as price action was setting up below a 52-week high while relative strength was already accelerating to new highs. On Friday, price action did breakout. Now, it's the simple case of "trend will be your friend until the one time it's not". A good tool to define downside risk is a trailing stop-loss order.
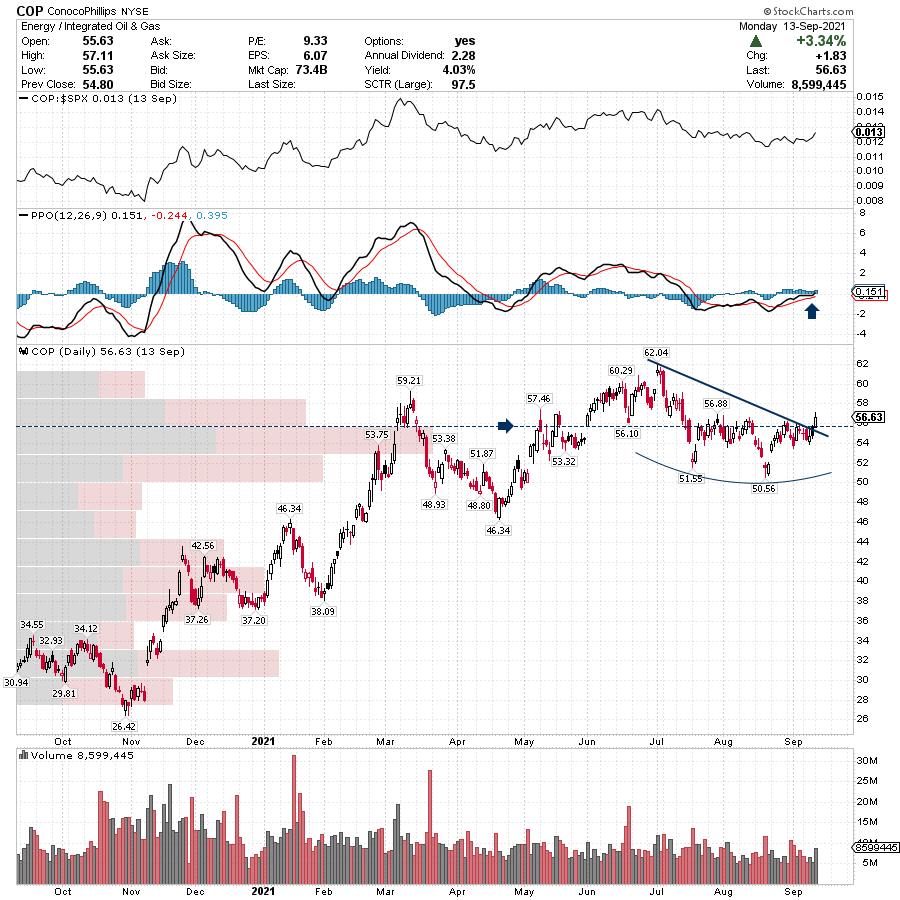
ConocoPhillips (COP) is a chart I first highlighted in the Daily Setups on September 13, 2021, when price action was at $57.59 and was starting to push above the apex of a continuation pattern and above horizontal resistance, while the PPO momentum indicator was threatening to breakout above the zero line. When the PPO crosses above the zero line, it indicates that momentum has turned positive.
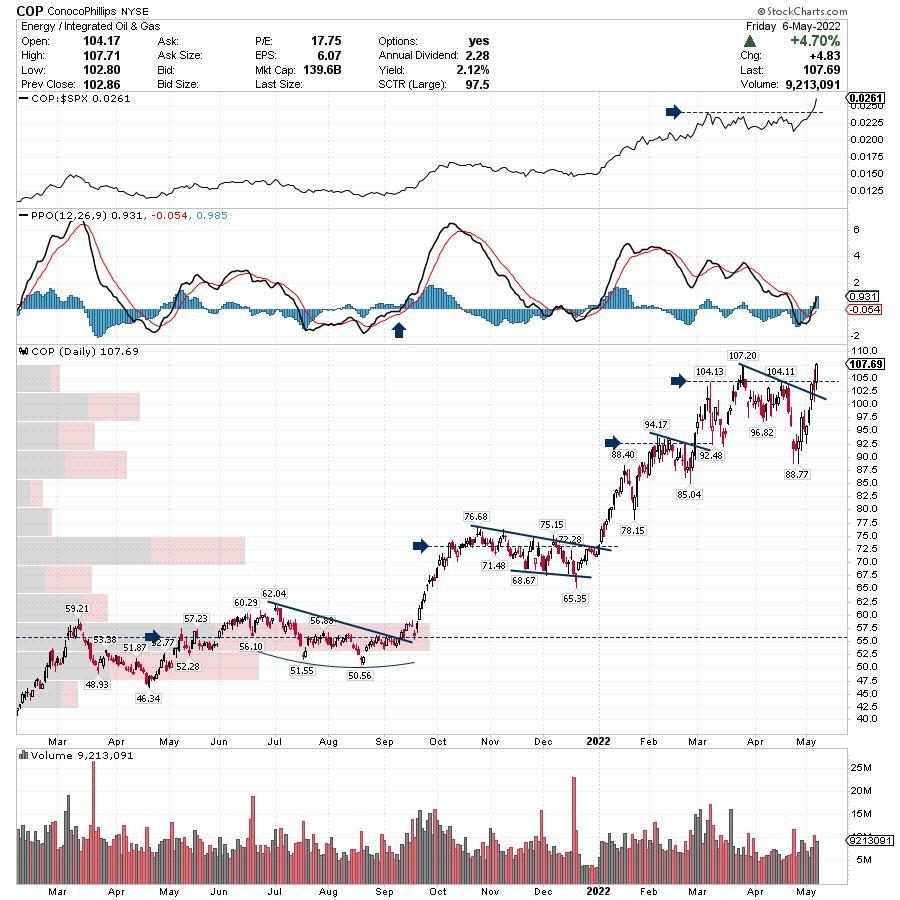
Since then, price action went on to surge $50.10, or approximately 87%. Many more signals were highlighted in the Daily Setups during that uptrend. The most recent was this past Thursday when price action was setting up below a 52-week high and I alerted our readers to watch for a breakout, while relative strength accelerated to new highs. Like the Pioneer Natural Resources setup above, price action did breakout on Friday. Now it's also the simple case of using a trailing stop-loss order to define downside risk.
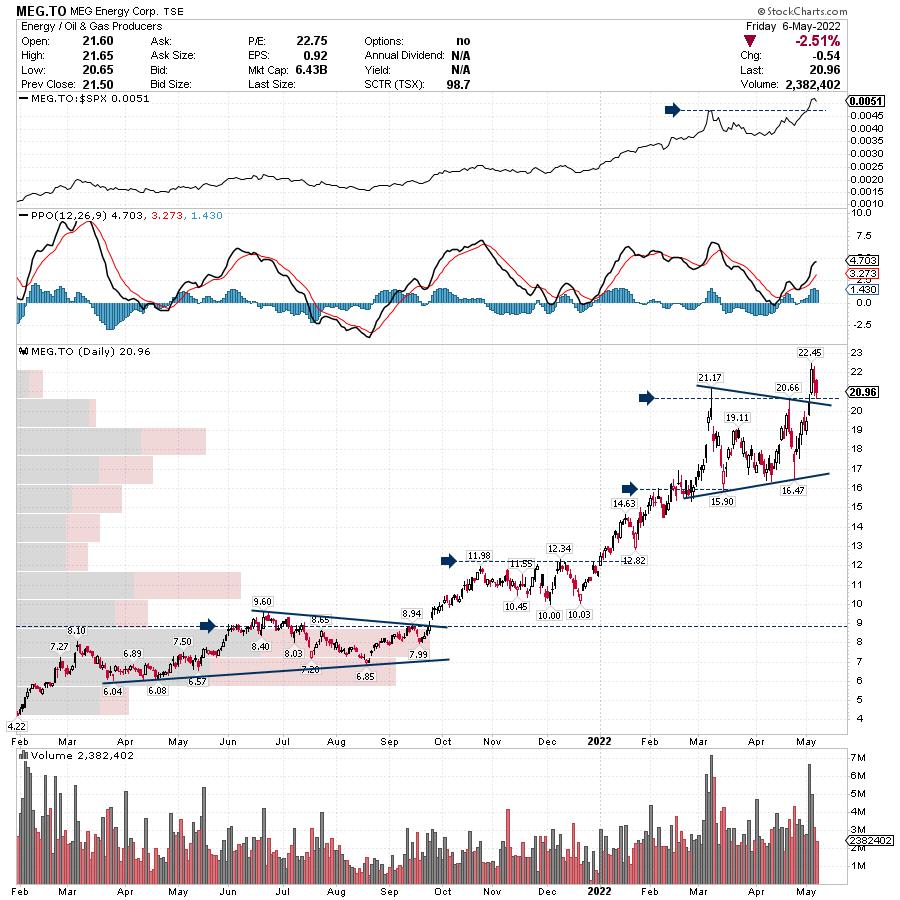
Meg Energy (MEG.TO) is a chart I first highlighted in the Daily Setups on September 23, 2021, when price action was at $8.63 and was threatening to breakout from a multi-month consolidation / continuation pattern. I suggested a stop-loss order could be placed at the $7.99 price label in case of market failure.
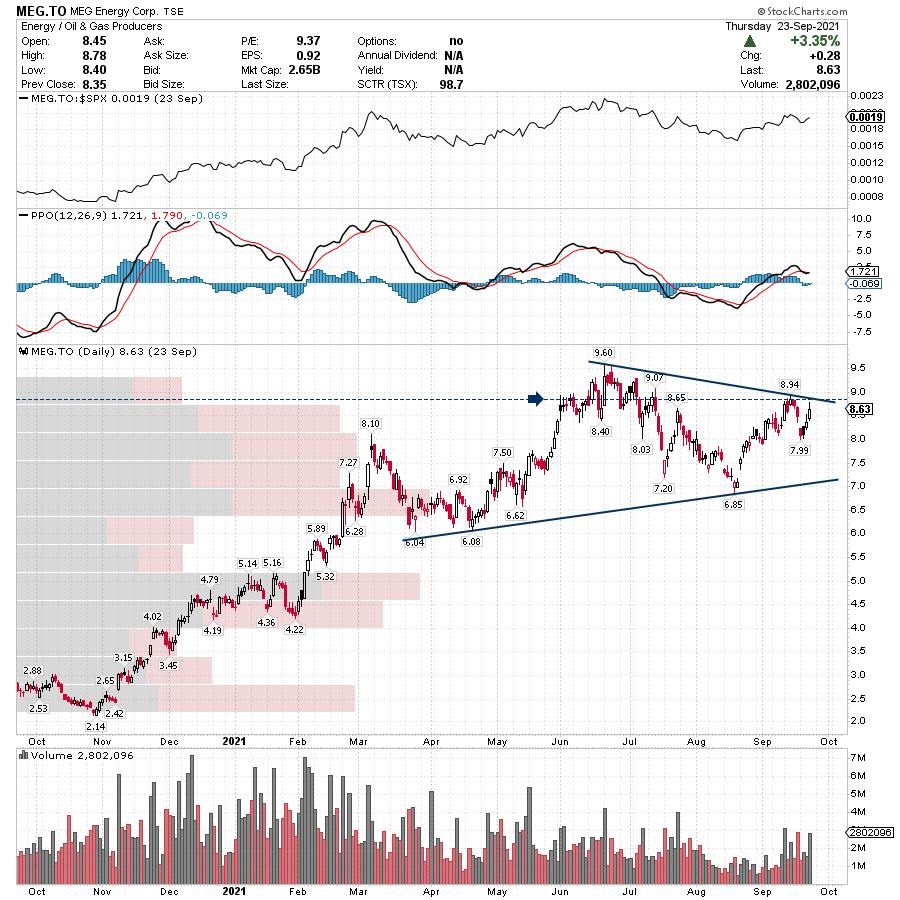
Since then, price action went on to surge $13.51 or approximately 160%. Many more signals were highlighted in the Daily Setups during that uptrend. One of most recent was on April 27, 2022, in the SetYourStop blog (which is also featured on the Osprey Strategic Website), when price action was setting up near the apex of a continuation triangle. That signal went on to return nearly 20% in 5 days. Now, price action has come back to retest the breakout line. This is where one wants to watch for a continuation of the uptrend while defining downside risk.
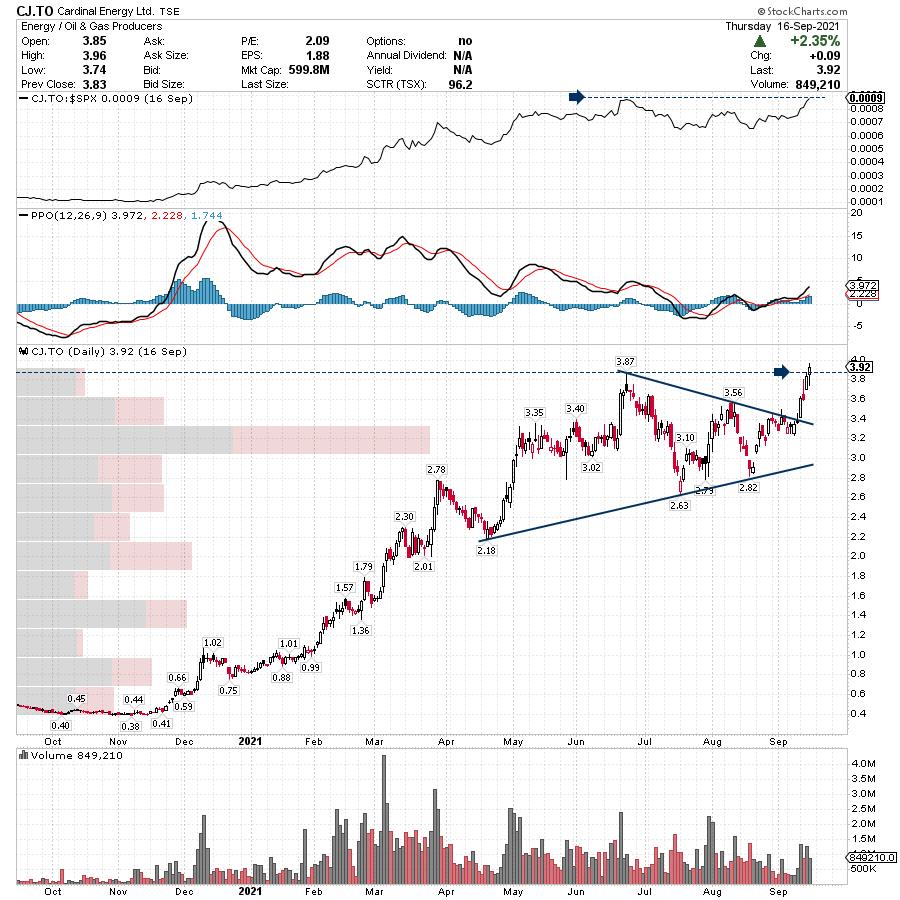
Cardinal Energy (CJ.TO) is a chart I first highlighted in the Daily Setups on September 16, 2021, when price action was at $3.92 and was threatening a 52-week high breakout from a continuation triangle.
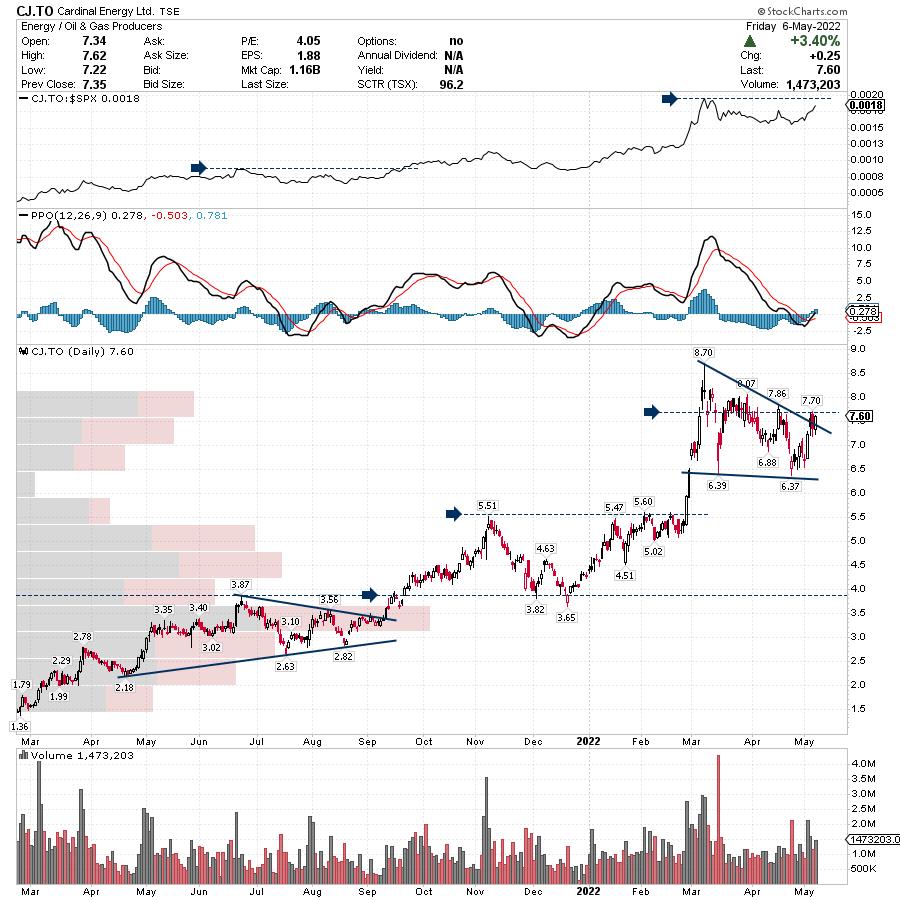
Since then price action went on to surge $4.78 or approximately 120%. Many more signals were highlighted in the Daily Setups during that uptrend. The most recent was this Friday in the SetYourStop blog, while price action is threatening a continuation pattern breakout with relative strength improving. A breakout from this technical pattern would be very bullish and suggest a continuation of the uptrend.
These charts above are the style that I present in my daily email. These are not recommendations, but they represent nice setups. In the description of each of these stocks above, I mentioned that a trailing stop can be used to protect capital. As most industries are in a bear market, energy-related trades are one of the few remaining industries holding up. If energy-related trades also start to fail, these good setups can also fail. Stops are always recommended.
OK, I hope you enjoyed reviewing some of the setups. Dwight does great work each and every day, helping our clients find nice setups. Because of the way Dwight organizes his work, he also notices when new sectors and industries are starting to outperform.
If you are worried about missing the signals for when to get back into the market, I think you'll enjoy the benefits of being a client at OspreyStrategic.org. Our annual package works out to less than $20/week. Follow the link to the homepage and take our trial offer. It's up to you to take the first step.

Good trading,
Greg Schnell, CMT, MFTA
Senior Technical Analyst, StockCharts.com
Author, Stock Charts For Dummies
Want to stay on top of the market's latest intermarket signals?
– Follow @SchnellInvestor on Twitter
– Connect with Greg on LinkedIn
– Subscribe to The Canadian Technician
– Email at info@gregschnell.com


