The stock market is stuck and many investors are having trouble understanding why it can't bounce from here. The purpose of this article is to shed a little light on the problems in the bond market and how they are influencing the other markets.
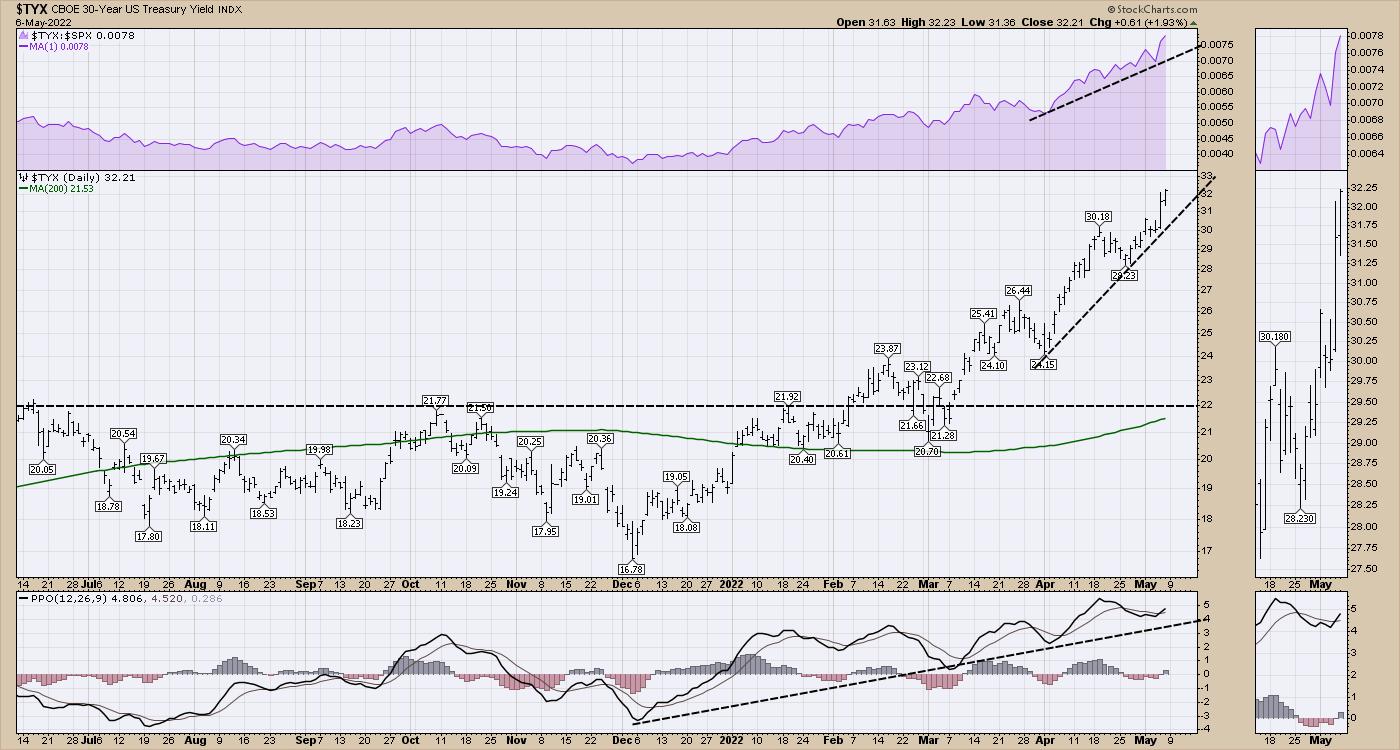
First of all, what is going on with the US yields? The 30-year yield is up 8% in two days. That is speeding right along. It's the rate of change that puts so much pressure on everything.
While this is going higher, the US 10-Year is rising. This increase in borrowing costs changes many of the base levels in the USA and some around the world. The USA has a lot going for it, including having many of the largest companies in the world based in its tax realm. However, other countries in the world can't afford to have their interest rates soar, so they are trying to hold them down. One example is Japan.
Japan
Japan's percent of Debt to GDP is one of (if not the) highest in the world, so it's important for them to keep their interest rates extremely low. This debt level as a ratio is more than double the US Debt ratio. If interest rates spiraled out of control, this would be an economic time bomb. It is on my radar and I have been discussing this in my client newsletters since April 9th.

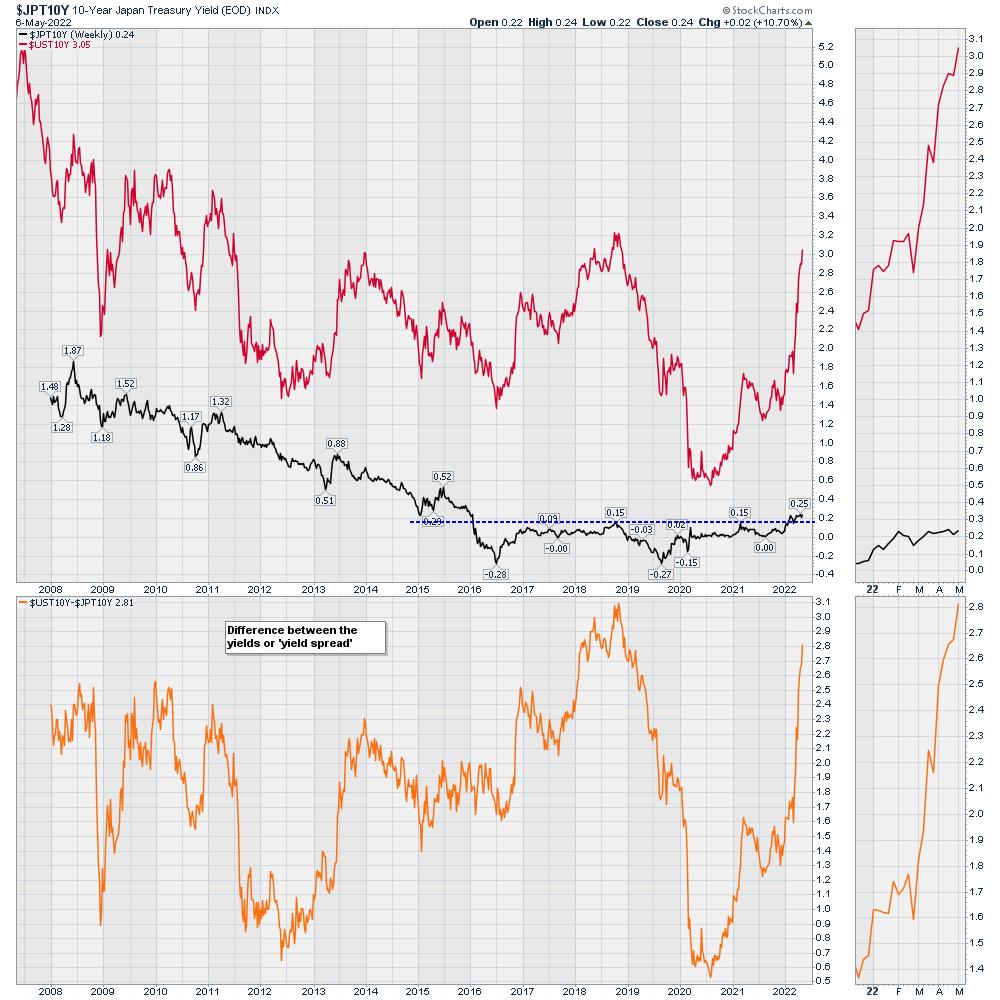
When we chart the situation, it creates a graph that is getting very stretched. The chart below shows the Japanese 10-Year at the bottom inside the first panel and the US 10-Year in red. They were slightly more stretched apart in 2018, but now we have soaring inflation, so the rapid moves up on the US chart are putting extreme pressure on Japan. We have had a spread this wide (Orange lower panel) before, but only once. The Fed came to the rescue to fix it then.
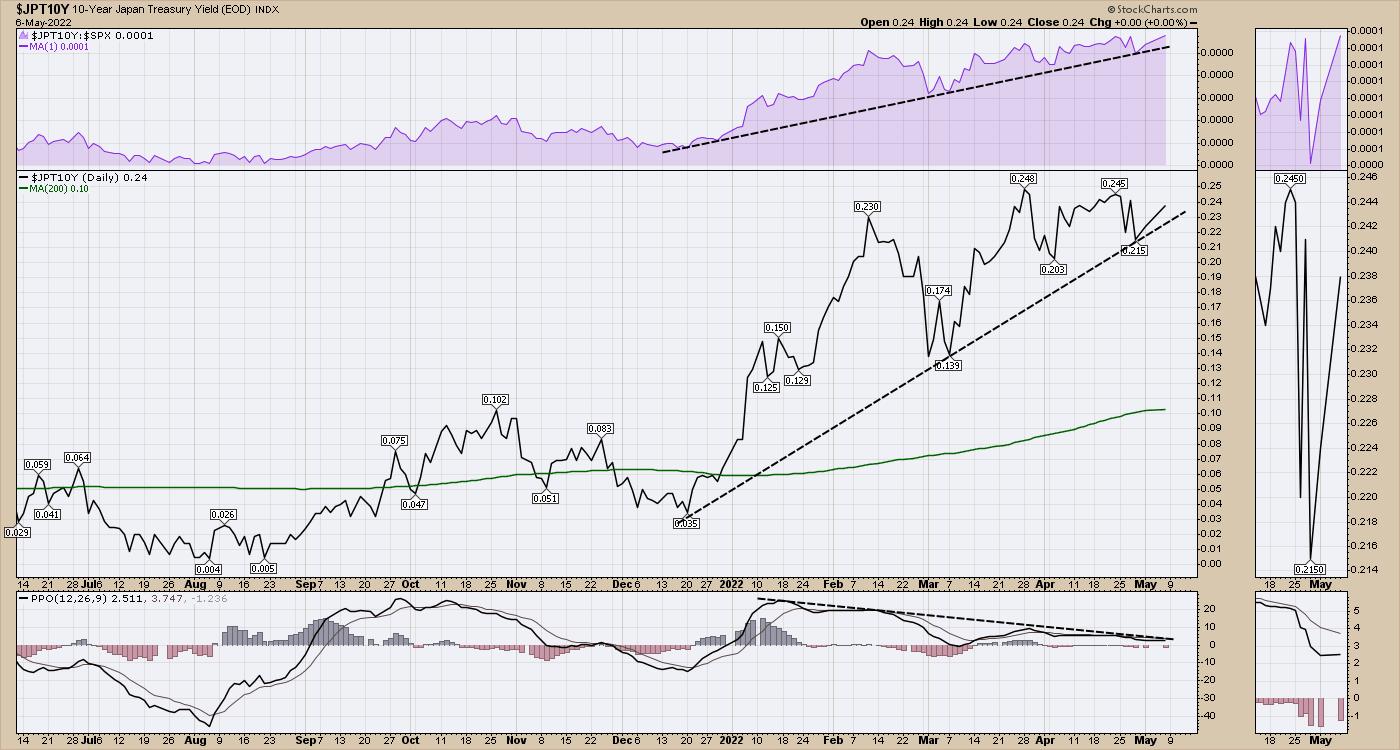
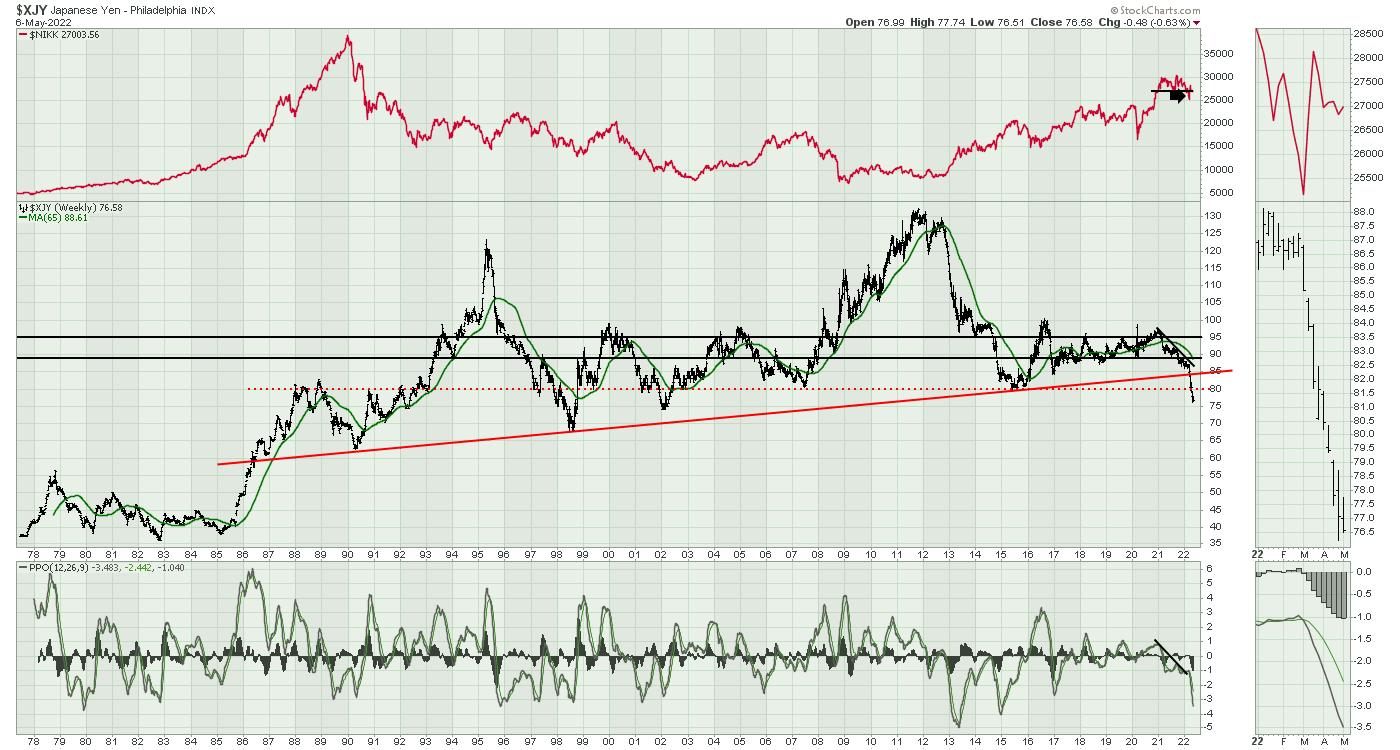
The chart below is the same black Japanese 10-Year as the chart above, but the computer changes the scale to fill the whole panel. The real question is, can the Japanese Central bank maintain the large spread by holding the yield at 0.25% or less? Or will the pressure to let it rise in an inflationary environment become too great?
If they don't let the yield rise, then the Yen falls, which makes everything the country imports that is priced in US Dollars more expensive for Japan, and the Yen continues to fall. I have plotted this as the Yen to the dollar to be consistent with other currency charts in this article.
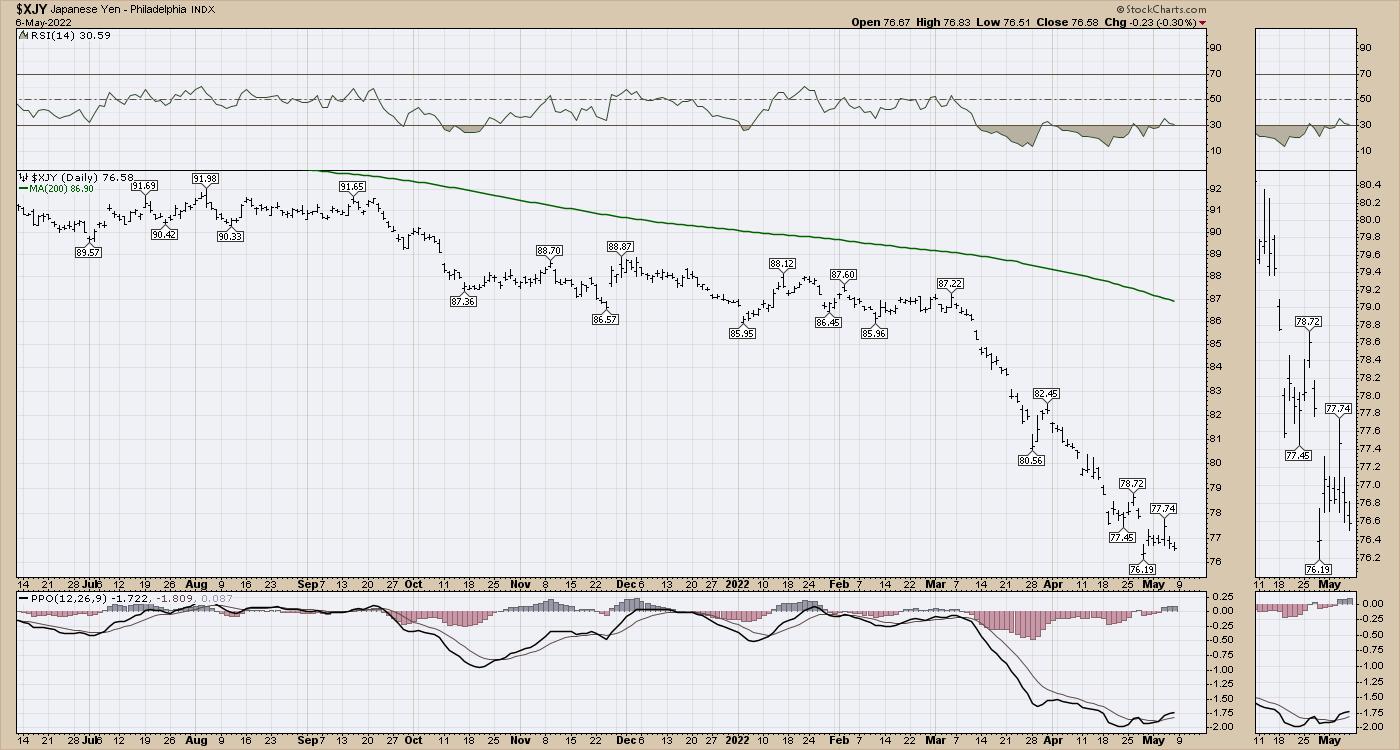
The long view on the Yen is that it broke the 35-year uptrend earlier this year, and has now fallen below a 20-year support level. It's dropping like a stone.
Euro and other currencies
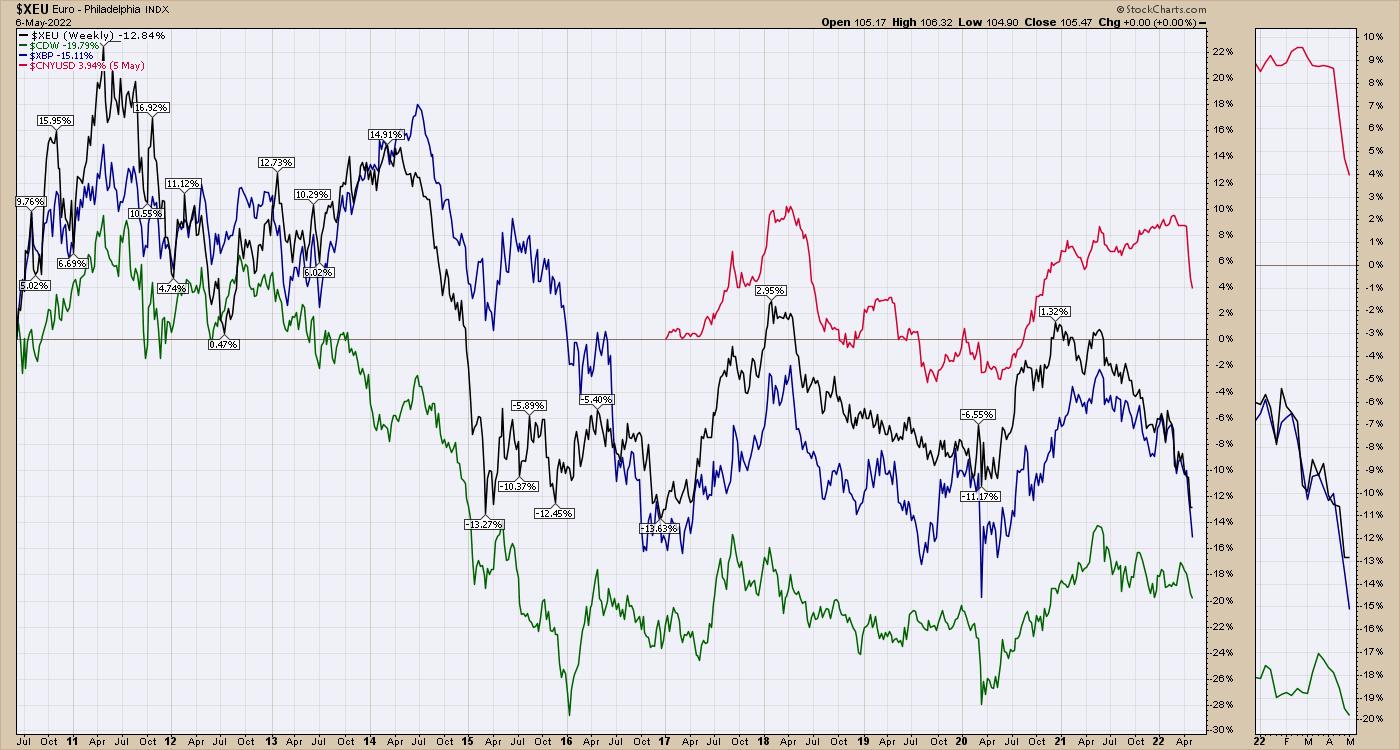
When I look at other major currencies, they are falling hard as well. The Euro, the British Pound and the Chinese Yuan are all dropping like stones. The Canadian Dollar in green is falling hard as well, but the fall is just getting started.
The US Dollar
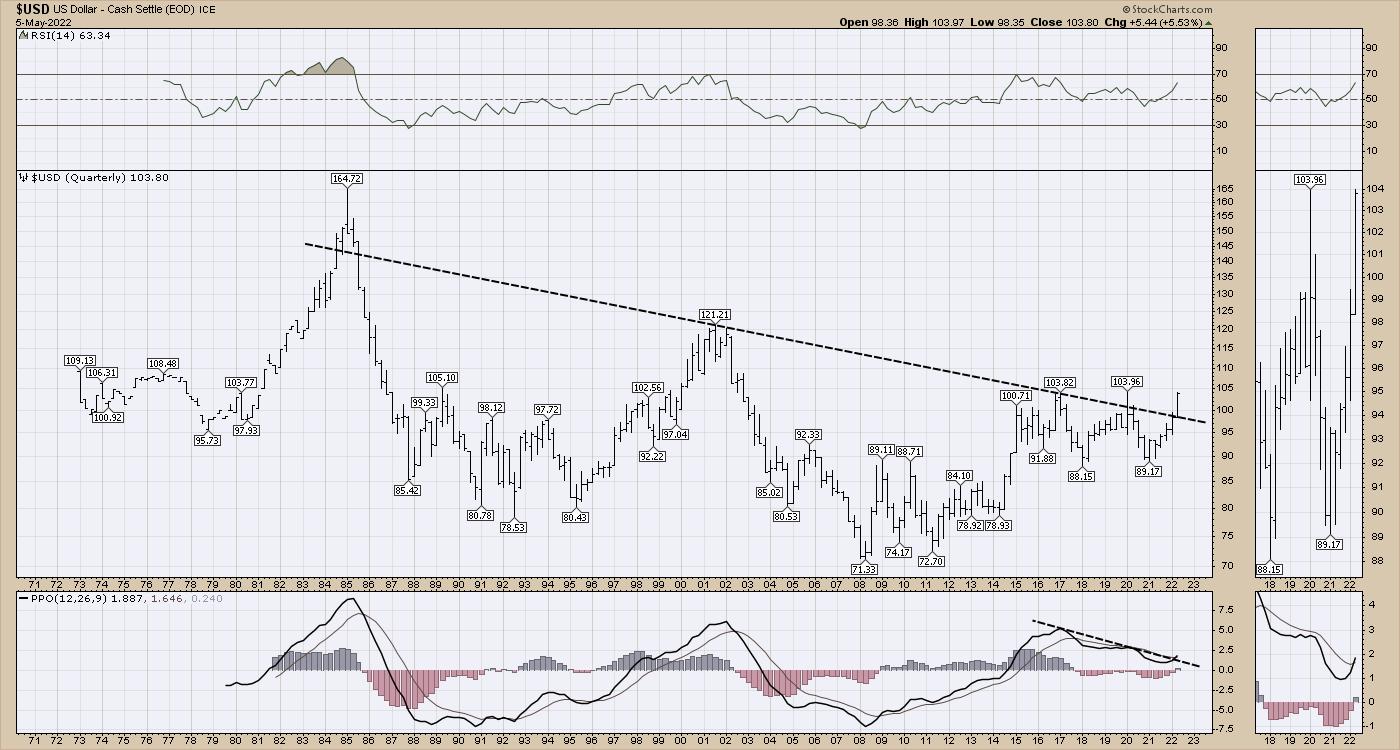
Obviously, the other side of all these currency pairs is the US Dollar. The issue is that, as the other currencies fall, the dollar rises. This quarterly (3-month) chart below is breaking a 36-year downtrend. There was a brief surge during the COVID kickoff, but it quickly retraced. Closing out June above the 104 level would be 19-year highs and create a series of higher lows and higher highs on the long time frame. Investors all over the world recognize how much the war in the Ukraine will affect future trade. If the costs for goods are going to soar around the world as the retraction of global trade occurs, this is inflationary. When items are priced in US Dollars, it is very inflationary when your currency is dropping and the price of goods are rising.
With the rapid, long-term significant changes in both bonds and currencies, it is no surprise that the stock market is also showing signs of major changes. On May 6, 2022, I narrated a 10-minute Your Daily Five video for StockCharts TV that covers these charts more thoroughly.
Your Daily Five -- May 6, 2022
Conclusion
As these major changes are forcing companies and governments to reprice and reposition their approach to the new economic conditions, all of these charts are snapping important long-term trend lines. Soaring inflation is a problem. The high-yield bond ETF (HYG) and the corporate bond ETF (LQD) are both dropping in a garden hose waterfall similar to the daily Yen chart above. Either we find support soon, or more assets start to go over the waterfalls.
A simple example of how extreme things are is the move in the US 30-Year bond interest over the last 2 days (0.22%), which is almost a double of what the Japanese interest rate is being held at. Just imagine if Japanese debt payments started to double, and that's where everything starts to come off the rails. What if those debt payments have to triple? Or quadruple? Until it falls apart, it is nothing, but once it starts, the vibration through the financial system would be large.
If you would like to check out more of our work, click on over to OspreyStrategic.org. We also have a trial for $7 for the first month there.
Good trading,
Greg Schnell, CMT, MFTA
Senior Technical Analyst, StockCharts.com
Author, Stock Charts For Dummies
Want to stay on top of the market's latest intermarket signals?
– Follow @SchnellInvestor on Twitter
– Connect with Greg on LinkedIn
– Subscribe to The Canadian Technician
– Email at info@gregschnell.com


