More experienced investors have a feel for the swings in the market. Bear markets are very difficult to trade, and there is an important reason. When an investor has a big winner, they generally don't like to sell them, as they still see the uptrend resuming. Commodities have a particular feel to them and, at Osprey Strategic, we focus on the moves in commodities and the related trades, as they can move as fast as technology or faster.
There are some very important trend changes taking place, and I have been highlighting some of them on Twitter space broadcasts, as well as the MoneyShow broadcasts I did in May. Here is a fresh new change I highlighted today to clients.
The Lumber chart and the Wood ETF are closely related, but the charts have dramatically different shapes. The lumber chart is an example of a trend that is subtly losing support. I have been following these charts each week discussing their lack of correlation. Our original 2022 loss of support was at $1100 when the uptrend in lows broke in early 2022. However, there is now a larger trend breaking.
The price bar is subtly breaking the 2-year trend, but the size of the move is huge. The move of almost 9% looks like a normal weekly price bar.
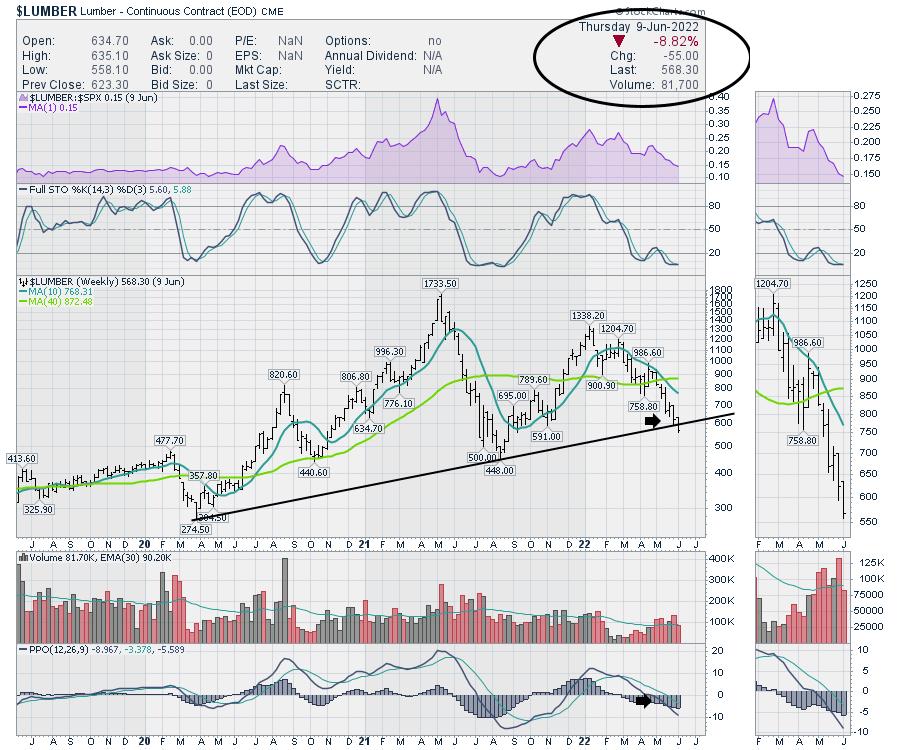
When we look at the lumber stocks, they have moved sideways, while lumber prices have been dropping since February. The charts look uncorrelated.
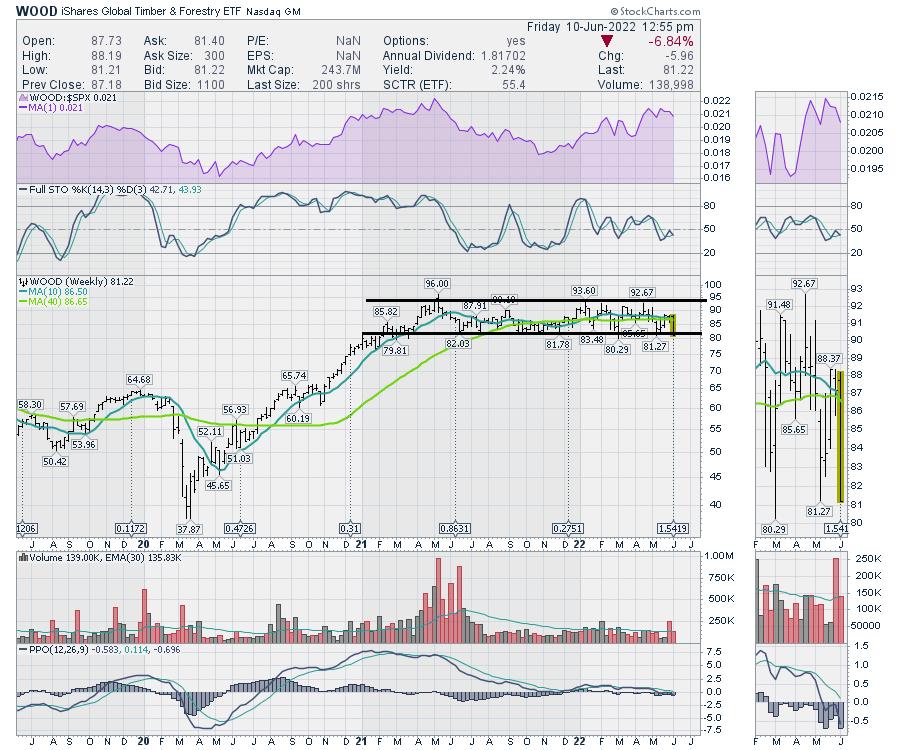
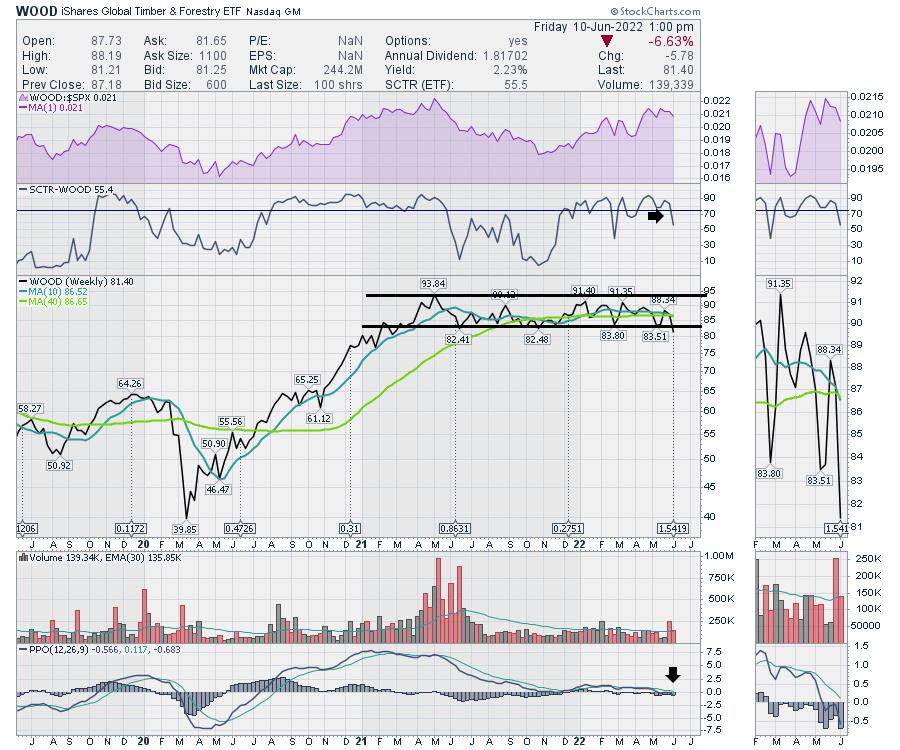
However, this chart also misses some clues that can be redeemed by looking at the chart with different settings. First of all, a line chart below shows this Friday close as a new 52-week closing low. It coincides with the trend break on the Lumber chart. It is a big deal that these charts are breaking together.
The SCTR ranking is also falling out of the top ETFs. This is a real nice confirmation signal of the broken price trend, suggesting that this chart is also starting to underperform other ETFs after a strong period of outperformance.
The weekly review I did Friday (June 10th) at noon for clients highlights many charts that are changing. Some positive, some negative, but a huge week for chartists to see the changing texture of the markets.
We offer a $7 one-month trial at OspreyStrategic.org. If you have any sizeable investment-related commodity charts, this would be a very important weekend for you to get caught up on the news for only $7. You can also go back through the previous videos to get a feel for if our newsletters and videos would help you save capital and put timely capital to work.
Good trading,
Greg Schnell, CMT, MFTA
Senior Technical Analyst, StockCharts.com
Author, Stock Charts For Dummies
Want to stay on top of the market's latest intermarket signals?
– Follow @SchnellInvestor on Twitter
– Connect with Greg on LinkedIn
– Subscribe to The Canadian Technician
– Email at info@gregschnell.com


