On this week's Market Buzz, I walked through the end-of-month charts for the rest of the world, which are sitting at a positive but precarious situation. The question for us all is: Are we heading into a prolonged bear market?

The European markets have rallied for 3 weeks already, while the US markets have only been rallying for a week.
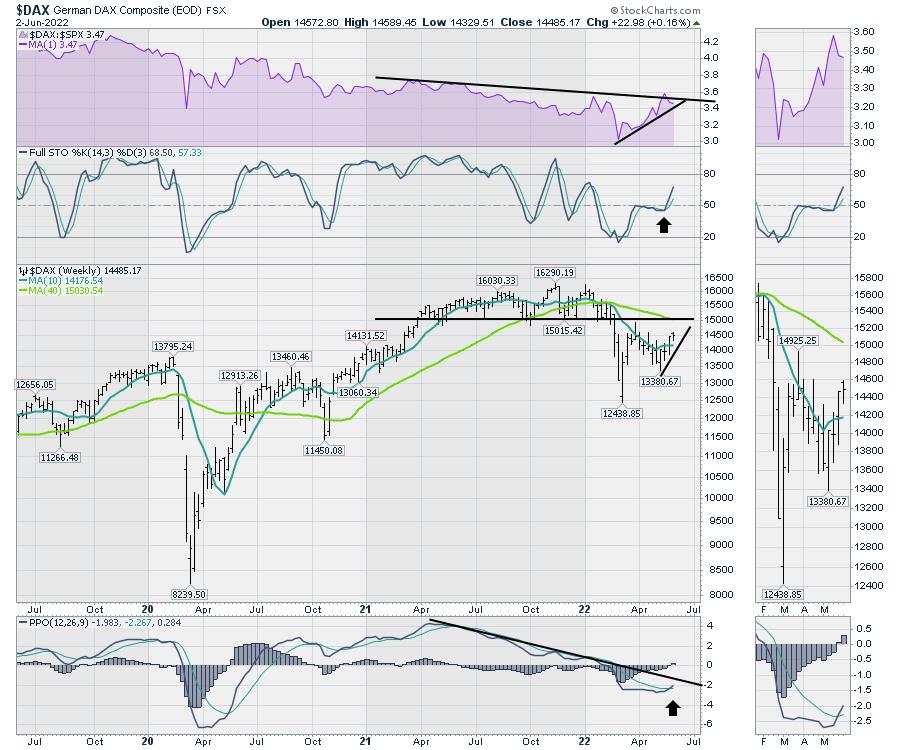
Here is an example of Germany on a weekly chart. A few positive surprises. The Full Stochastic indicator on a weekly chart soaring higher above 50 is a great visual! Usually, in bull markets, this will bounce up around the 50 level, whereas, in continuing bear markets ,it will roll down as it rallies up from the lows at the 50 level. So the continuing rally on this indicator suggests more strength.
The Weekly PPO (momentum) is giving a positive cross for the first time since 2022 began. The low in early May was a nice turn higher. This is a great start and, as price progresses higher, this will rise up.
Those are the positives on my indicators. The next view is to stare into the price chart. The price has moved above the up-sloping 10-week moving average (WMA), which is very positive. The 10-week moving average is a short-term overlay that helps us notice the short-term price trend. As it flattened out in 2021, it told us to be a little more cautious.
The bigger question now is the 40-WMA, which is a long-term moving average of 3/4 of a year. It is down-sloping and is positioned just where the market broke down below support at 15000. While we can have short-term rallies at any time, the bigger question is if this market completely rolls over as it rallies up to 15000. We would call this a back test of the support/resistance level of 15000 if it fails.
Looking at the black trend line on the PPO, the indicator could rally a little more, but if it fails at the black trend line, that would suggest a much bigger problem for this chart. Historically, during a bear market, the PPO will stay below zero and roll over below zero, marking severe weakness.
When I look at most of the European markets, they look about the same.
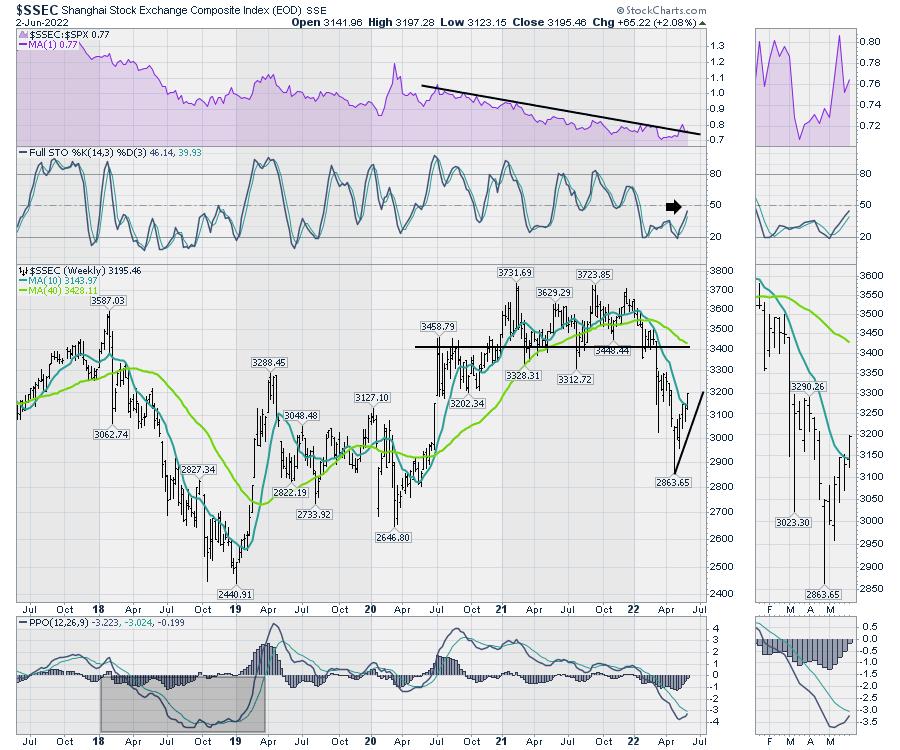
Rolling into the Chinese market, they have been having trouble getting the COVID situation under control. However, that market has been rallying for 6 weeks. It pushed above a down-sloping 10 WMA to start the month of June. The chart has similar characteristics to the German market, falling below support at 3400 and now rallying back up to the underside of that line, which is now resistance.
The full stochastic is still below 50 but still pointed up. The PPO momentum indicator has not triggered a buy signal yet.
I highlighted the bear market of 2018 for the Shanghai market during the tariff tussle. Notice how the indicator does not rally above zero until it is over.
Now let's use the same setting for the $SPX. It would appear that everything is just a few weeks behind the rest of the world.
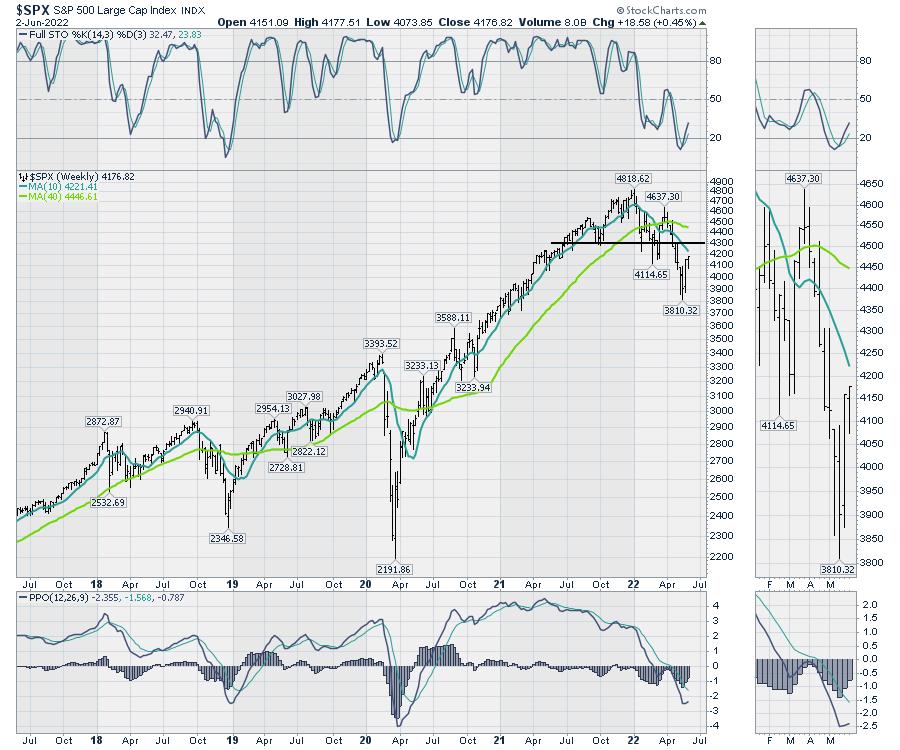
As long as the markets can continue to rally globally, that is a helpful backdrop for the US rally to continue. The fact that the US rally is the last one to start is a little odd, as the US market is typically a leader.
The message this week from Jamie Dimon of JP Morgan was definitely concerning. As the leader of one of the worlds biggest banks, the guy doesn't usually relay pessimism to the masses. He's a straight shooter, but chooses his words carefully. When he uses the hurricane word with economics, it's a bit of a gulp moment! See here.
How to trade it? I think you want to be nimble. If this rolls back down, it could be a bigger drop than most of us are expecting. For now, the charts are tilted higher!
Good trading,
Greg Schnell, CMT, MFTA
Senior Technical Analyst, StockCharts.com
Author, Stock Charts For Dummies
Want to stay on top of the market's latest intermarket signals?
– Follow @SchnellInvestor on Twitter
– Connect with Greg on LinkedIn
– Subscribe to The Canadian Technician
– Email at info@gregschnell.com


