The stock market is not necessarily the cleanest, easiest way to make money. When the sails align with the wind direction, it can be swift. When the wind switches, just tacking can be hard work. Wednesday morning finds us rapidly tacking to maintain our position. The low the market is trying to make appears to be reversing quickly with Tuesday's 3% move down on the QQQ. This suggests the recent move up might not have enough strength to hold.
Follow through day
The follow through day on Friday that failed leaves us all wondering what is next. What is the follow-through day, what is a failed follow through day, and why is this concept so important?
When the market tries to rotate from down to up we need a couple of things to happen in a sequence of events to make the turn. The numbers correspond to the chart.
- We make a low with an up day following it. (We stop going lower).
- After at least 3 more days go by, we get a big move (>2%) higher on higher volume (Friday).
- The critical factor is that we don't take out the low of the follow through day. We did on Tuesday.
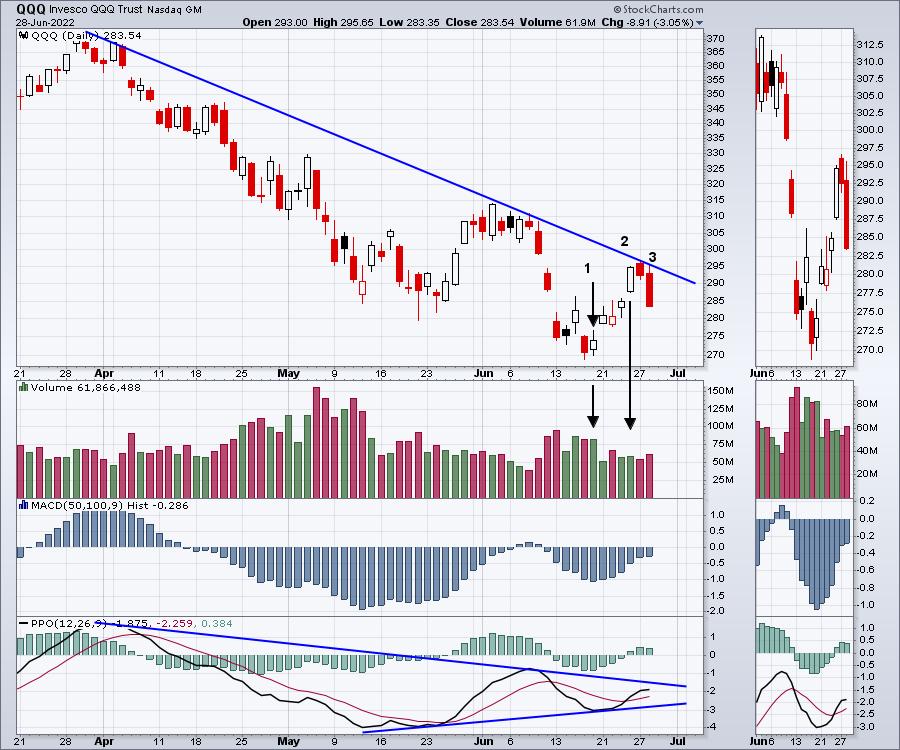
From my perspective as a technician, this setup for a low had all the reasons I would look for to work.
- The PPO made a higher low (June 19) while price made a lower low causing positive divergence.
- The downtrend line on the PPO looked ready to be breached suggesting a major change in trend. It did not break with the move back down.
- The histogram pattern is similar to the one Alexander Elder describes in his work. He looks for the 'breaking the back of the bear' - as a Histogram pattern, and this was also in place. If anything was 'wrong' with this setup, the histogram pile was a little too wide - May 26 to June 10. We would prefer a histogram pattern like blue histogram above the PPO where it is just a few days.
- The market had a wash out move down June 9, 10 and 11.
- The market lows happened shortly after an Options Expiration day or a Fed meeting (Both).
So the real question is now what do we do? The right answer as always is the market is always right. We don't know how deep the selling will go. We need to control our risk. The pattern on the index has clearly failed. Now we need to monitor and accept small losses if the stocks we bought fail to hold here.
A Position I Am Trading
This is how I interpret that for one of my purchases.
I bought where the black arrows are as the price broke above the former support/resistance line.
Now the price has pulled back and looks weak as it falls below my green dotted line Keltner bands. Making a low after a large decline always has wide swinging ranges. For me if the price breaks below $420, it will have to test the low under $390 and I won't wait that long to see if this holds. So this chart needs to find support shortly.
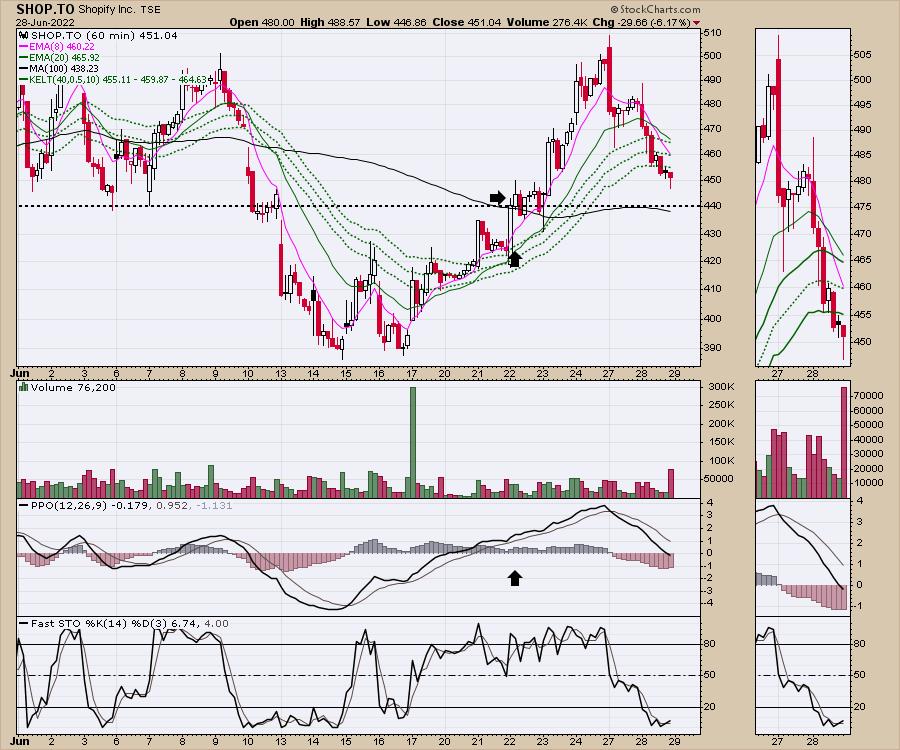
The breakout looked good and the pullback after the breakout was nasty. If the indexes can't hold up, that pushes additional pressure on this trade. At the time of writing the QQQ was down a whisper from Tuesday's close. I'll be monitoring the exits as I'll need some of the setups I bought to hold here if this market is going to make a right shoulder and go higher.
I know the snapback is frustrating me as an investor, and I'm sure I am not alone. But the inevitable wobbles don't make investing easy. It comes down to position size and risk management. We'll need to monitor both to keep capital for the eventual breakout rally. As we can now record this follow-through-day as a failed breakout, it still means we need to watch what stocks make higher lows as the market makes lower lows.
Good trading,
Greg Schnell, CMT, MFTA
Senior Technical Analyst, StockCharts.com
Author, Stock Charts For Dummies
Want to stay on top of the market's latest intermarket signals?
– Follow @SchnellInvestor on Twitter
– Connect with Greg on LinkedIn
– Subscribe to The Canadian Technician
– Email at info@gregschnell.com


