Commodities have been a standout for two full years since the COVID lows. However, the charts faced some significant hurdles this month. This article presents a new look to the commodity charts that could help equities.
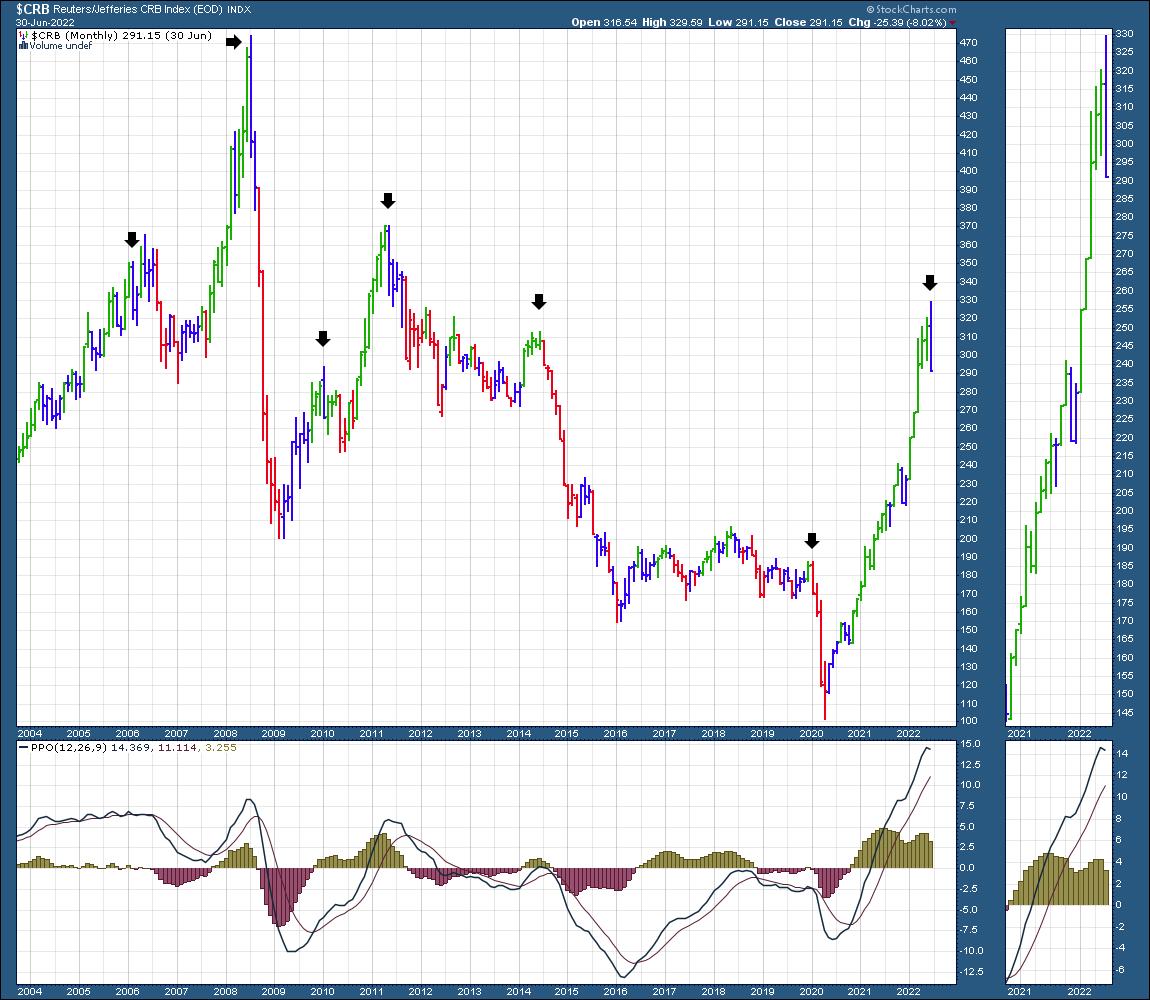
The CRB Index
First of all, the $CRB index closed with an outside bar for the month. Much to the dismay of bullish commodity traders, this is a caution sign for me.
When I look at the weekly chart below, it has some clues for us as well. The weekly PPO (momentum) is making a lower high and has now broken the uptrend in momentum. There are two specific pieces of information there.
1) Momentum rolls over before price. The momentum is currently waning.
2) The long trend line off the COVID low is breaking, implying, at a minimum, that the pace of the commodity advance is changing.
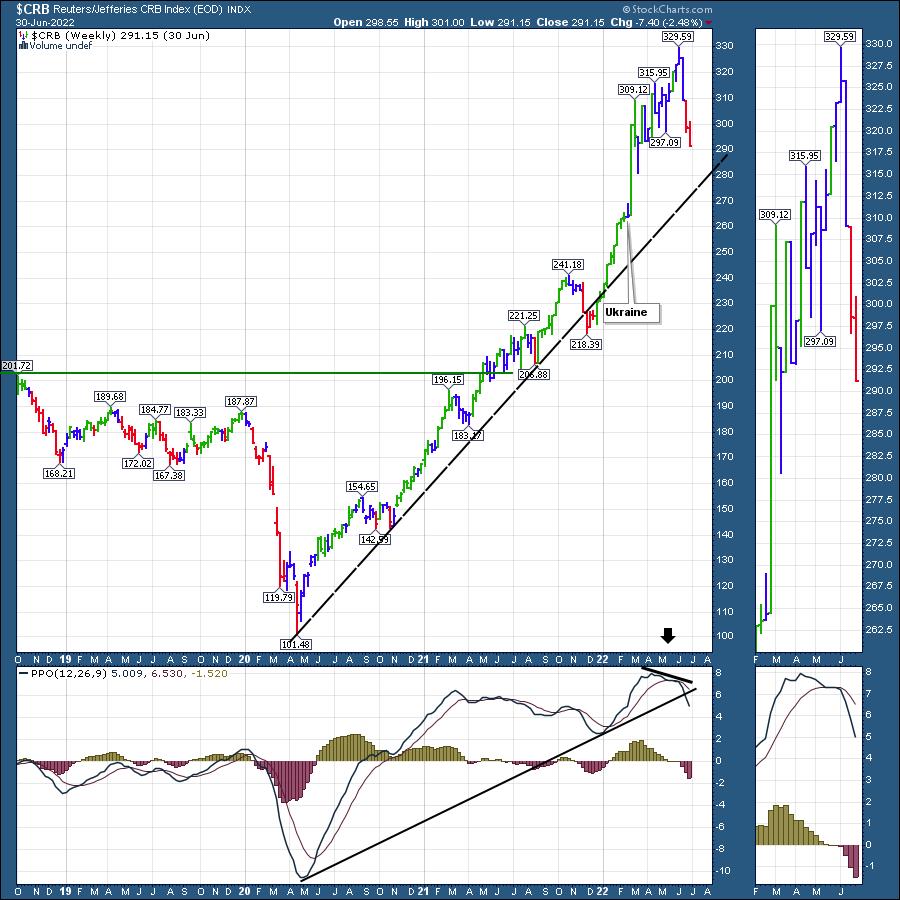
For investors in commodities, there are no obvious exit signs at the top. If you are looking for an exit sign, watching the price action of investors on these two charts above is a great way to be aware.
The top in commodities always happens when it looks so bullish, exactly like the start of 2022 for the equity markets.
Some other examples
When I think about all the commodity traders in the world creating these market patterns as a group, it's important to realize the change in behaviour.
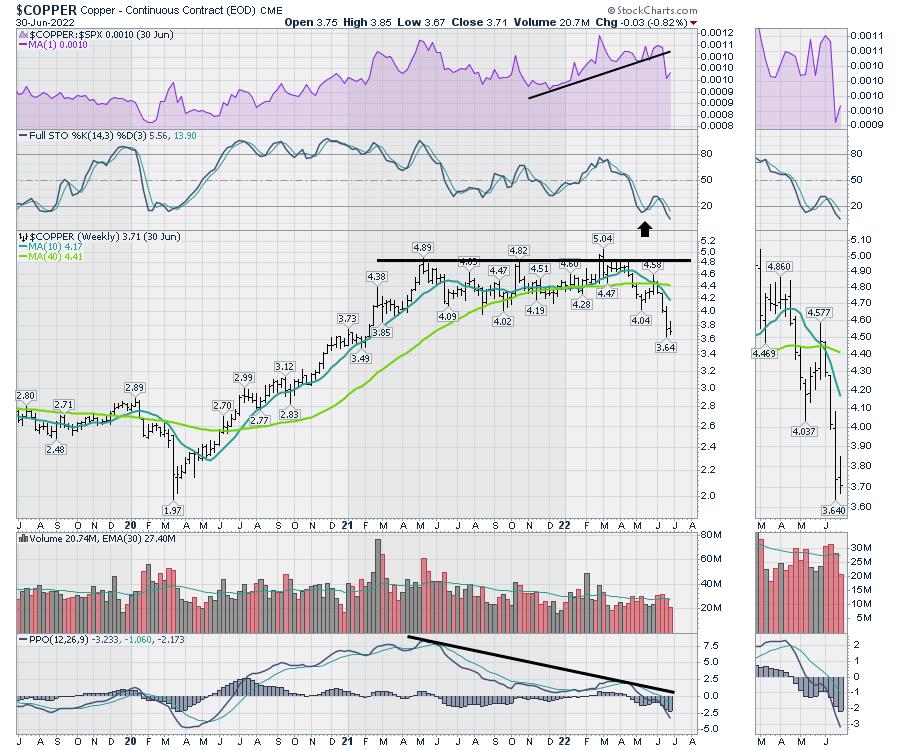
Below are two examples of specific commodities. Copper ($COPPER) has given a typical charting pattern of a major market top.
Below is Corn ($CORN).
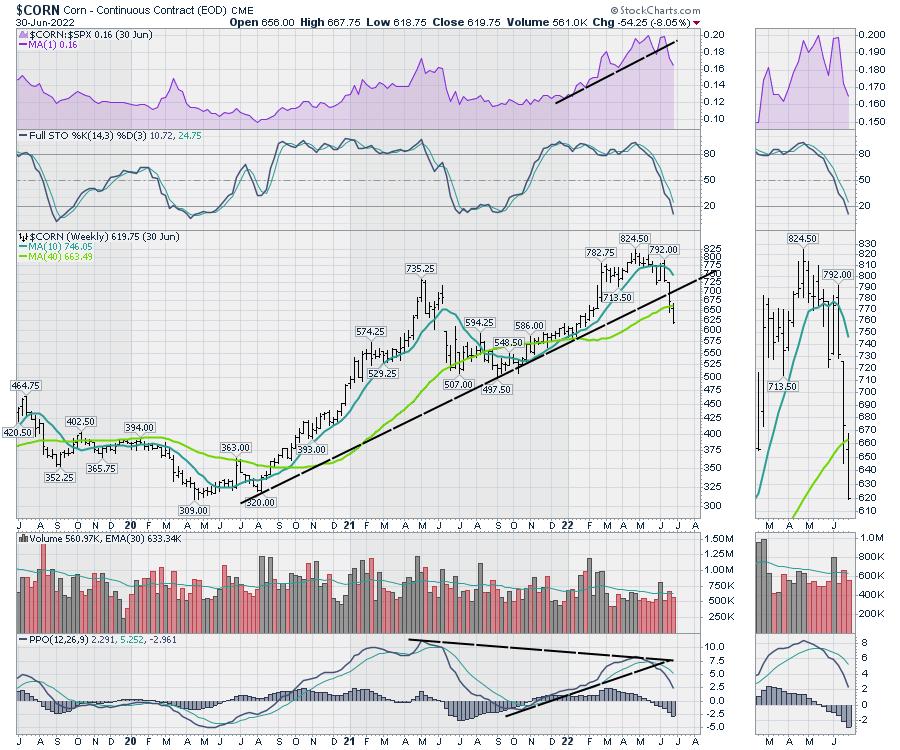
None of these charts are suggesting pullback. The recession will slow demand, and these charts are pricing that in until further notice. I've been warning clients about the commodities for a while, and they continue to break down.
If you would like more technical analysis information about the four asset class pillars, we'll be holding a monthly conference call for clients of OspreyStrategic.org the week of July 4th. For the price of a $7 trial, catch up on the changes in the market, including more than just commodities. That will also give you a chance to read the weekly newsletter and watch the latest weekly video.
Good trading,
Greg Schnell, CMT, MFTA
Senior Technical Analyst, StockCharts.com
Author, Stock Charts For Dummies
Want to stay on top of the market's latest intermarket signals?
– Follow @SchnellInvestor on Twitter
– Connect with Greg on LinkedIn
– Subscribe to The Canadian Technician
– Email at info@gregschnell.com


