One area that has sold off extremely hard is energy, but many of the stocks are holding near their 200-DMA. If this was a long-term rally, with a deep low down at the 200-DMA, this is where we would expect a bounce.
Here's an example of the oil chart on the 60-minute time frame. Notice the PPO trend keeps going lower. On Thursday, oil price pushed down to a lower low and rallied back to Wednesday's close. The chart doesn't look like it will be in an uptrend any time soon, but if the PPO trend could break, that could at least be a clue for a bounce to start on OE once again. Notice the break of the PPO trend as the price of oil topped out. The same break the other way is often bullish.
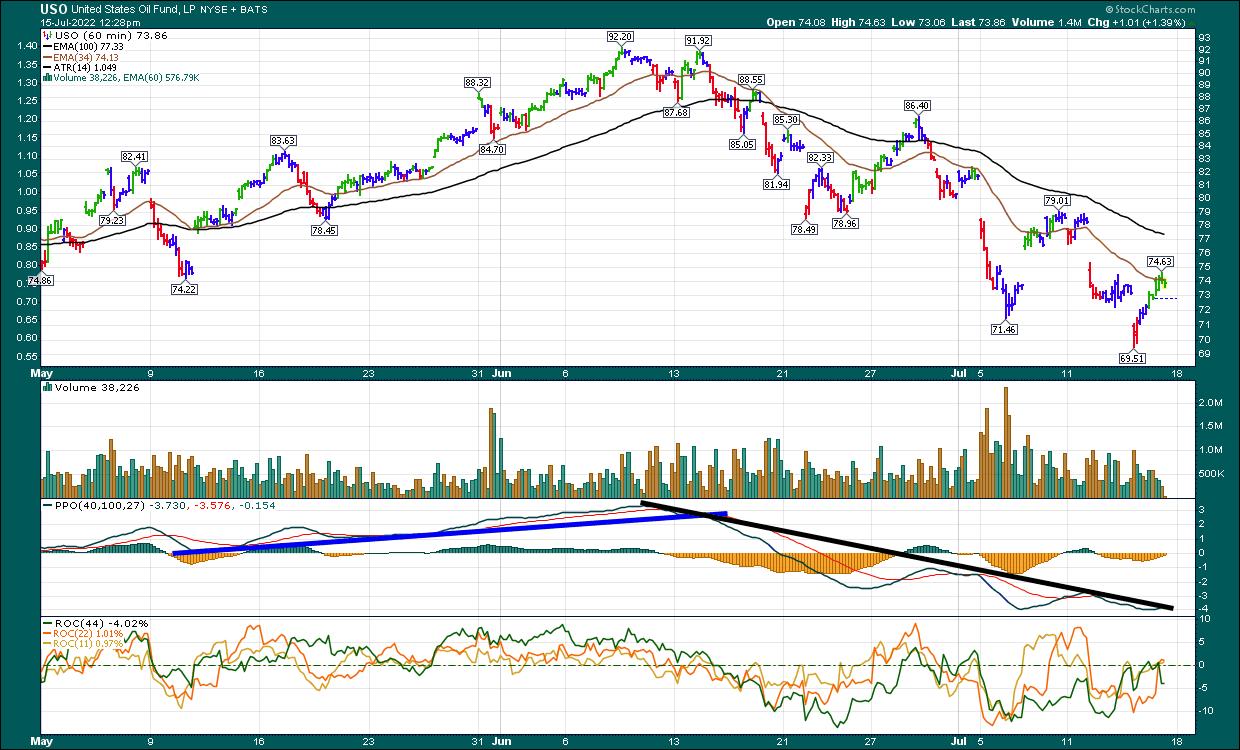
An good example of oil chart now might be the ETF for oil and gas producers. The ETF PPO is ticking higher.

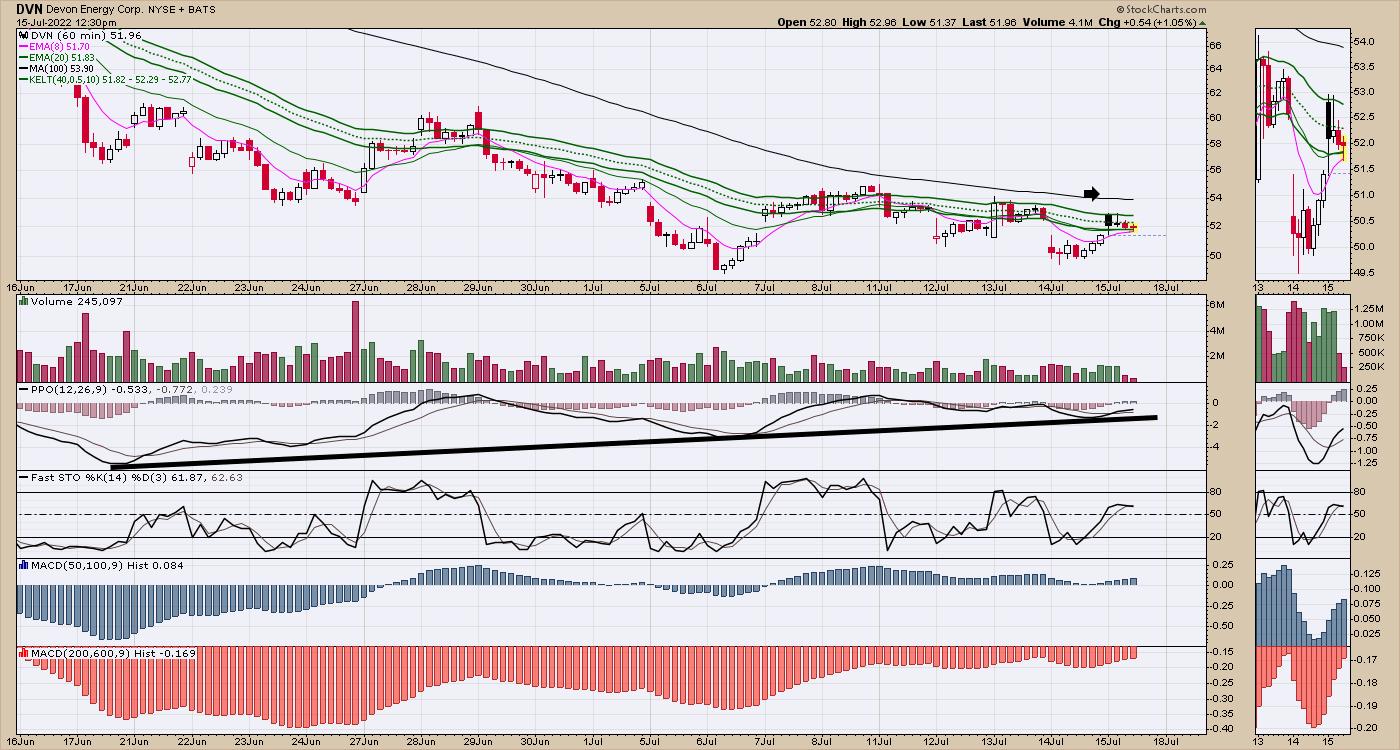
Some other names like COP have broken a little further, but DVN is a nice example of holding at the 200-DMA. A bounce back to the highs would be a 50% gain. The breakdown in the oil names hasn't made a lot of sense, with oil supply tightening and Europe in trouble. Whether or not the trade works is a big question, but at least looking for a breakout back to the upside makes sense. A break above the 100-MA line on the 60-minute chart is roughly the 20-DMA on the daily. That would be near an 11-day high, which has a much better chance of holding the breakout.
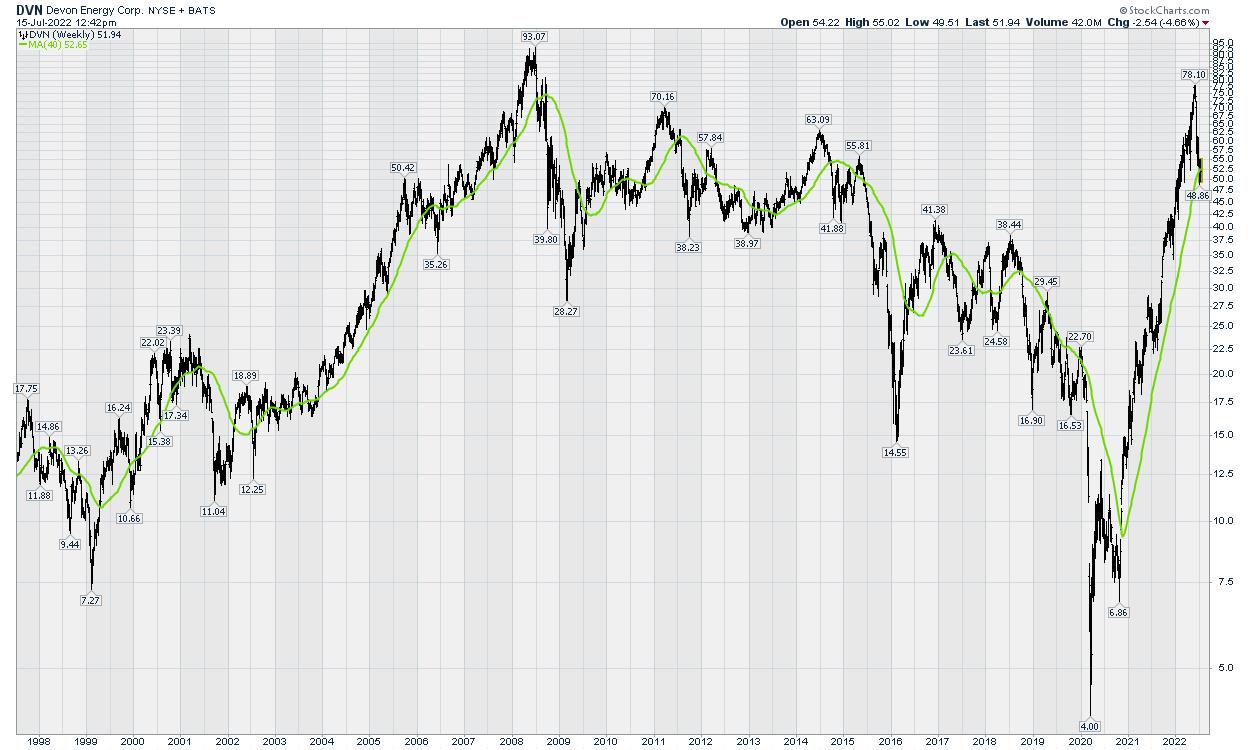
Using the 200-day MA or 40-week MA, notice how the 2003-2008 rise found support, usually around the 40-week, even after steep pullbacks.
For those wishing to wait for the bigger bull market, we can wait for the indexes to take out the 50-day moving average (at the least).
Am I bearish? Absolutely. The markets moved lower all week. But it's been a week up, a week down, a week up , a week down. If things start to improve in energy after the Middle East meetings, I'd like to have a preplanned approach, and energy is at least starting to flatten out. A PPO moving into positive territory on DVN would be a start, as an example.
Good trading,
Greg Schnell, CMT, MFTA
Senior Technical Analyst, StockCharts.com
Author, Stock Charts For Dummies
Want to stay on top of the market's latest intermarket signals?
– Follow @SchnellInvestor on Twitter
– Connect with Greg on LinkedIn
– Subscribe to The Canadian Technician
– Email at info@gregschnell.com


