The market is a moving target, where something new is starting to run and something that was working starts to fail. It's very frustrating for the buy and hold investor, but, for the technical world using risk management techniques, it is a continuously morphing event.
In 2021, the market had tech leadership, with the software industry doing extremely well. When tech leadership failed, we had materials and energy take the lead. Recently, some of the best-performing sectors have been utilities and healthcare. Financials tried to lift off the lows during last Friday's options expiration. Subtly, in the background, the tech stocks are starting to get a bid. How can we keep track of all this?
Well, a great guy named Sam Stovall came up with a rotational model. Here is the link to the page with it, though you need to scroll down a little to see it.
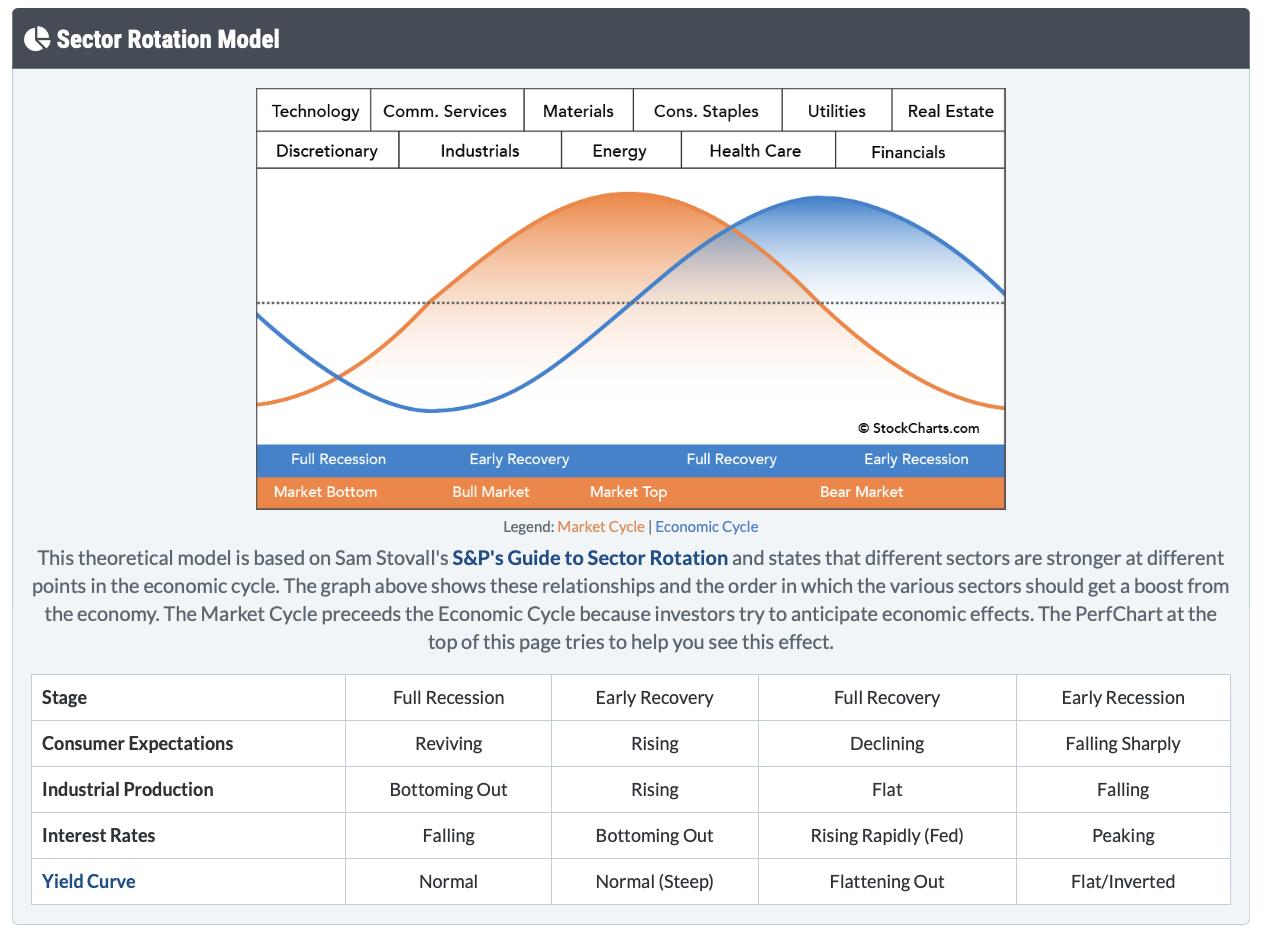
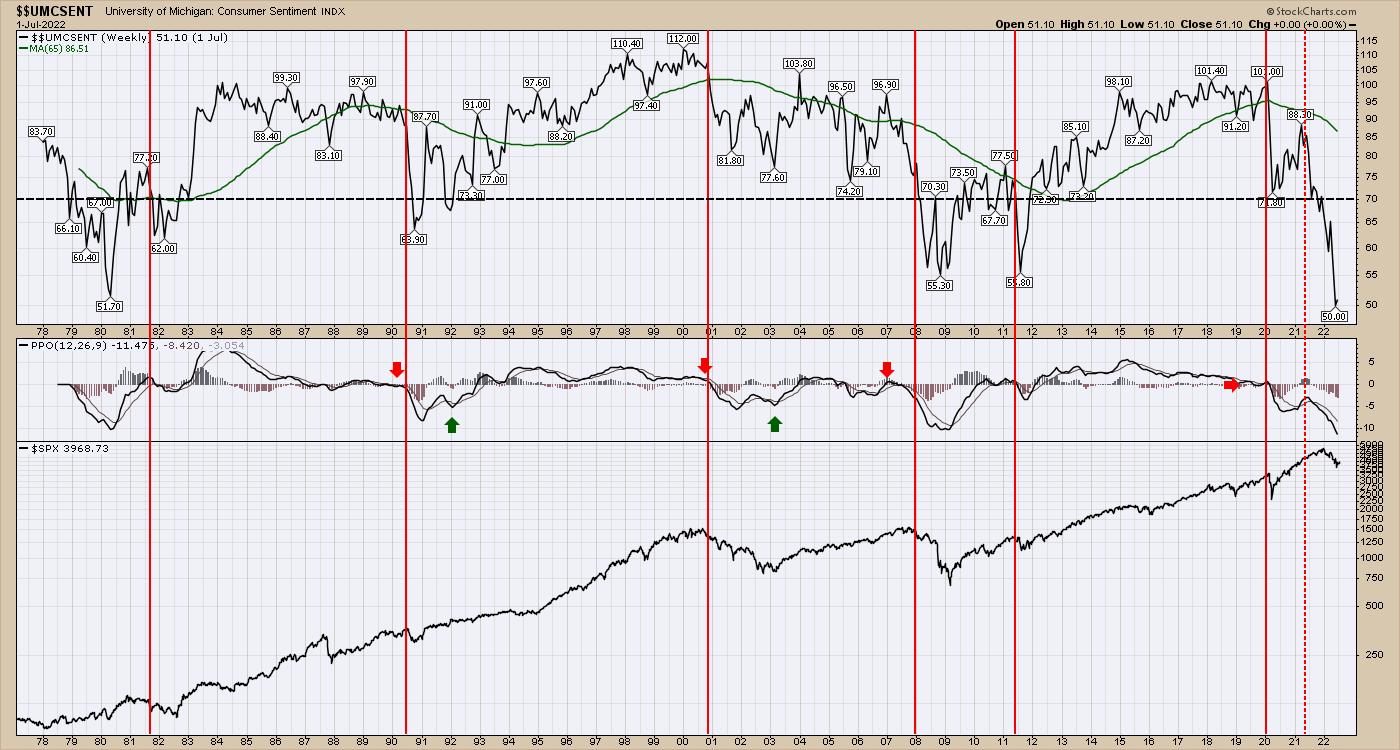
Analyzing where we are in the cycle is interesting with the little table at the bottom. Look at the last column, starting with "early recession." Consumer expectations falling sharply. University of Michigan consumer sentiment is at record lows.
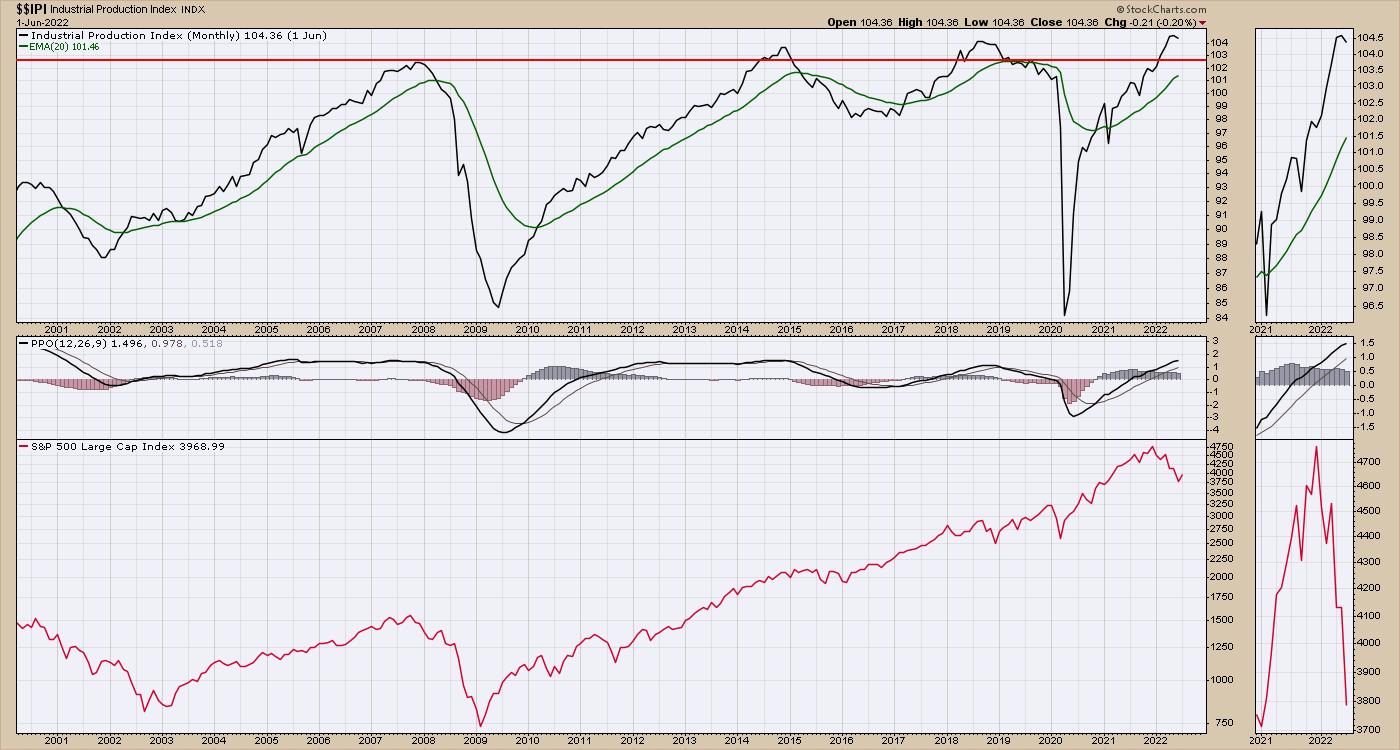
Industrial Production has been a mishmash due to supply chain problems. It's not falling sharply, but it is having end of cycle issues. Examples include automobile availability, appliances, port congestion, etc. However, it has started to roll over.
Interest rates are still rising, as the Fed is expected to announce another increase. But Bond markets are not accelerating higher, suggesting they think most of the move is done. Interest rates have been at this level for roughly three months, amazingly.

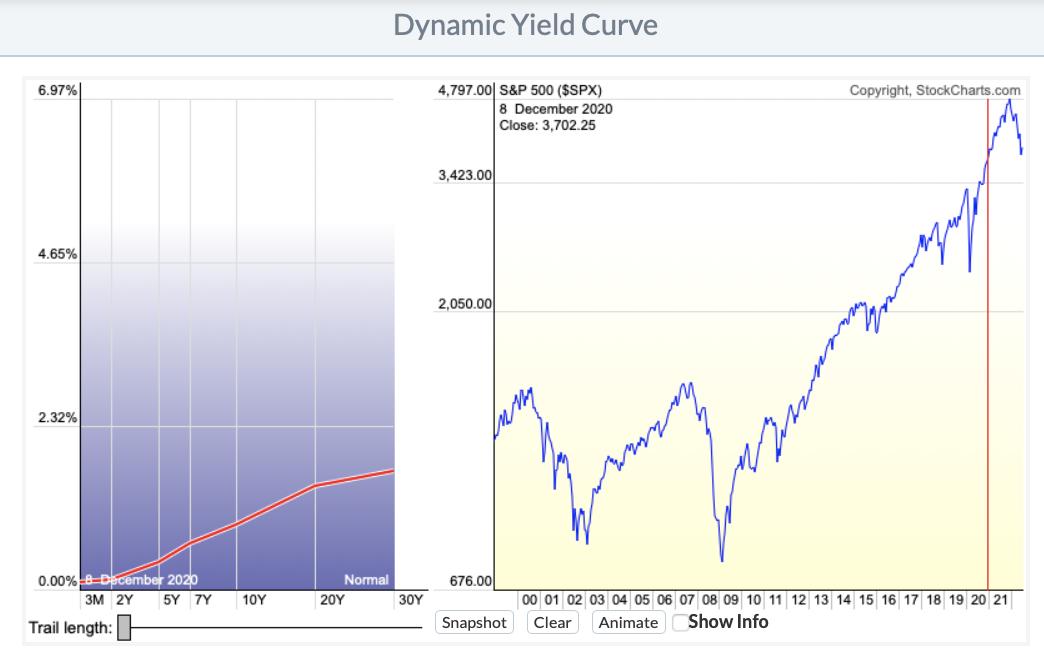
Lastly, we have the yield curve. There are some negative slopes between the time periods, which means an inverted yield curve.
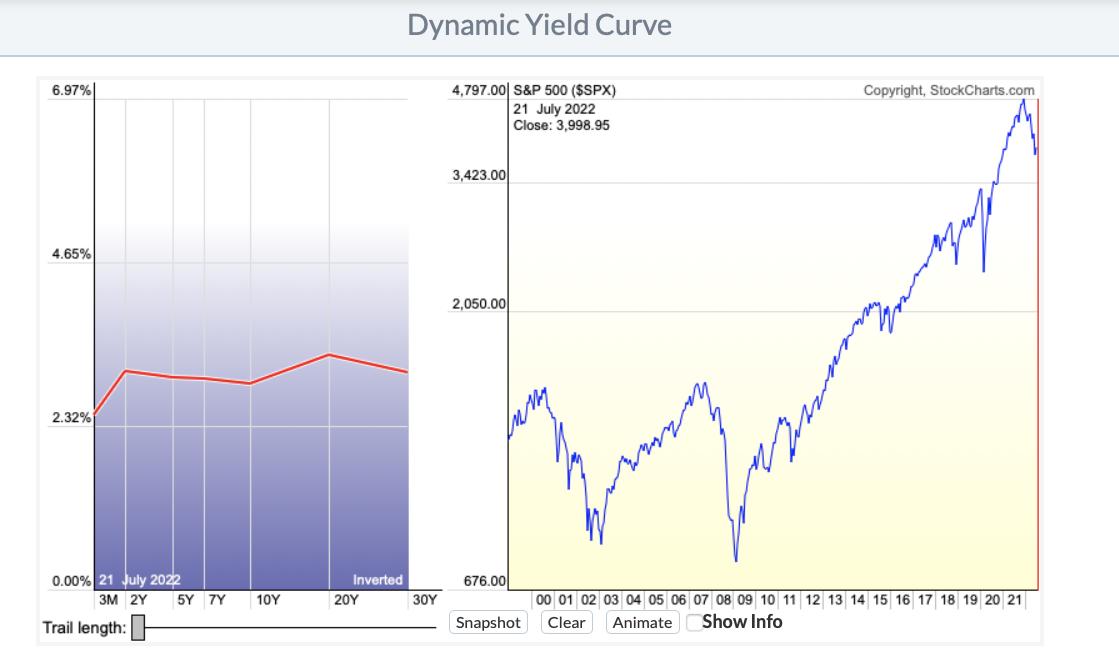
This is what a normal yield curve looks like.
This market model is working remarkably well. At Osprey Strategic, we try to keep clients aware of where we are in this rotation, to help find the next areas of opportunity. I try to keep clients abreast of the moving target called sector rotation. We also host a monthly conference call which is coming up next week. If you'd like to sample the OspreyStrategic.org offering, we have some trial subscriptions available for just $7. If you sign up before month-end, we also host a monthly conference call, which is coming up next week. Once you register, you'll be able to join in. Best wishes on your investing journey.
Good trading,
Greg Schnell, CMT, MFTA
Senior Technical Analyst, StockCharts.com
Author, Stock Charts For Dummies
Want to stay on top of the market's latest intermarket signals?
– Follow @SchnellInvestor on Twitter
– Connect with Greg on LinkedIn
– Subscribe to The Canadian Technician
– Email at info@gregschnell.com


