The commodities tried to rally, but stalled this week at very important technical locations.
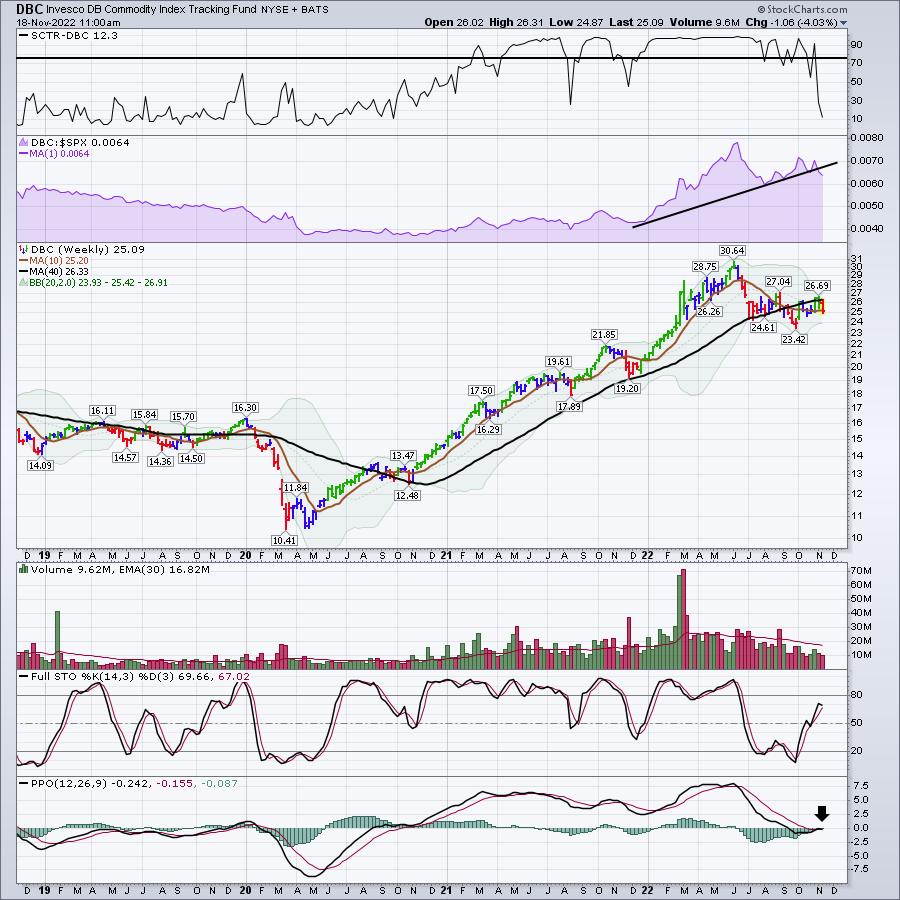
For example, the Invesco DB Commodity Index Tracking Fund (DBC) weekly chart doesn't look very good.
- The StockCharts Technical Ranking (SCTR) is plummeting after 1.5 years of strength
- First red candle since October started
- Relative strength in purple is breaking
- No volume
- PPO momentum is right at zero and struggling to go higher.
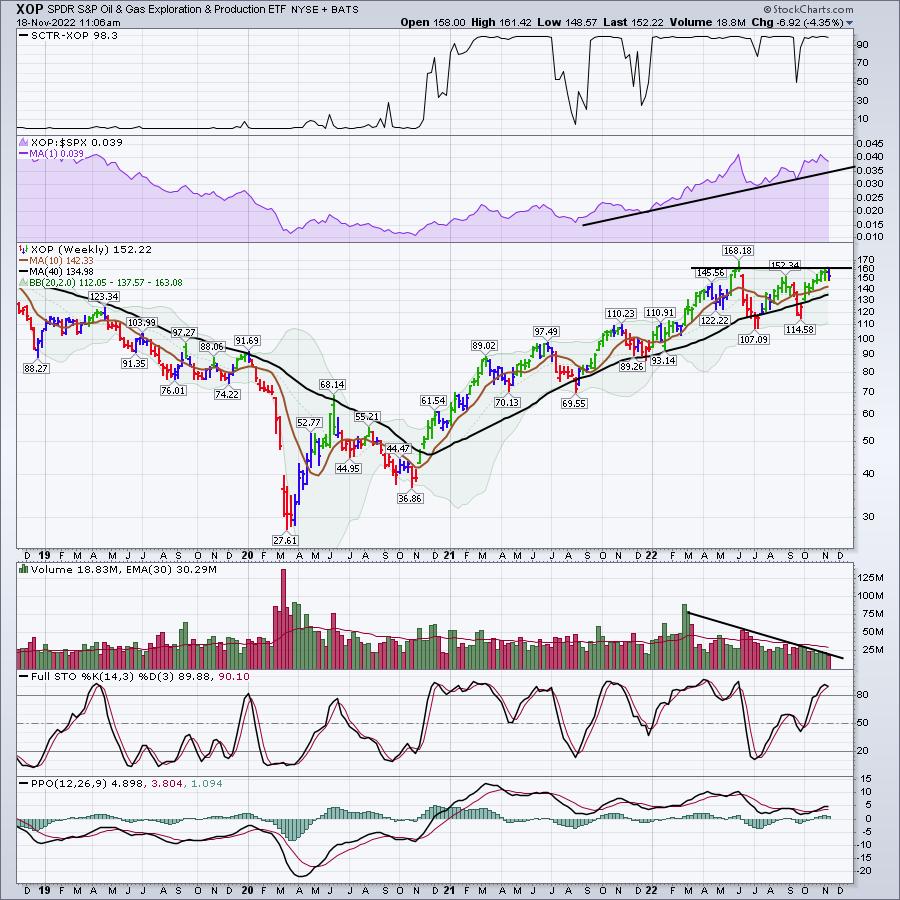
Now let's look at the SPDR S&P Oil & Gas Exploration & Production (XOP) (see chart below):

Oil exploration companies are struggling to take out the spring highs. They have been here for three weeks.
- Testing a prior high and struggling. Not uncommon, but hardly euphoric based on what the indexes are doing. The SPDR Dow Jones Industrial Average (DIA) is up 20% off the lows
- First blue candle at least hints at a weakening trend
- No volume coming in
- PPO losing upside momentum.
I would say this is still a strong chart, but ,based on the DBC chart above, it is worth watching closely.
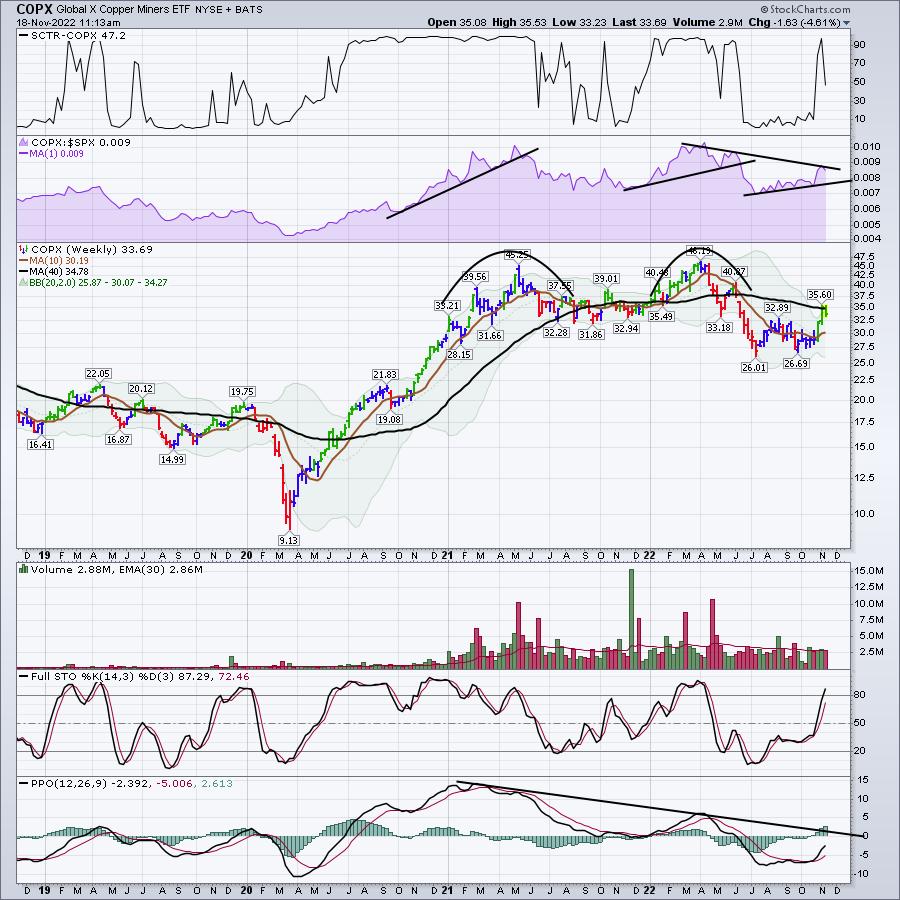
I was thrilled to see copper break out, only to then see copper miners bang their heads on the 40-period weighted moving average, an important resistance until broken. The SCTR ranking is failing to hold up and the PPO is below zero; it needs to continue to accelerate higher.
For me, it's starting to look a lot less likely that commodities can soar. One week doesn't make a trend. I'll have a lot more in my weekend newsletter. It's critically important that we understand the economic indicators like housing, copper, oil, including commodities in general. If you would like to see what we offer, feel free to try a subscription for $7 at OspreyStrategic.org. It will let you check out our past picks and newsletters as well.
Good trading,
Greg Schnell, CMT, MFTA
Senior Technical Analyst, StockCharts.com
Author, Stock Charts For Dummies
Want to stay on top of the market's latest intermarket signals?
– Follow @SchnellInvestor on Twitter
– Connect with Greg on LinkedIn
– Subscribe to The Canadian Technician
– Email at info@gregschnell.com


