I had a long discussion with a great friend today about cryptocurrencies, Decentralized Finance (DeFi), Centralized Finance (CeFi), and the exchanges that are part of the landscape. He understands way more than I do on the subject. He is an accomplished student of all the changes going on in this space. I am a passive observer of the whole thing, viewing the related charts as I do any other investment.
For me, if crypto is a trade, it's based on a trend. If the trend changes to up, I am in. If that trend changes to down, I am out with a profit or a loss. Other people have a different philosophy around it. This article is a technical analysis of what happened this week looking at the price action and what it means for the chart going forward.
Analyzing Bitcoin, Technically
It has been exactly a year since Bitcoin ($BTCUSD) topped out (see chart 1). The top occurred on November 10, 2021 at $68978.64 and made a new low this week on November 9 at $15546.97. That's a 77% drop in a year. The chart shows the significant fall but it doesn't explain what happened in the space.
It shows a downtrend, but does it show that it is one of the largest one-year asset class losses we've seen? While the bond and equity markets have lost way more than $2T, it's the percentage of the original size of the industry that makes it so big and so fast. The crypto market is currently worth a trillion but it was over $3T at the peak.
Of course, in the long-term investor's eye, it's still going to the moon because it has done that at least twice before. I think the question to ask a crypto investor would be, "Why own it when it's going against you?" I have to wonder if there's a benefit to being the long-holding hero for something that's so speculative.

CHART 1: TECHNICAL ANALYSIS OF BITCOIN ($BTCUSD). Looking at the chart of $BTCUSD, it looks pretty beaten down. The percent price oscillator (PPO) and stochastic oscillator are in oversold territory. Price has fallen below its support level and compared to the S&P 500 Index, $BTCUSD is underperforming (see magnified version on the right). Chart source: StockCharts.com. For illustrated purposes only.
Chartcon 2022 Bitcoin debate
I was at Chartcon 2022 on October 9, 2022 where Dave Landry and I debated whether Bitcoin was a buy. Dave Landry, a great guy with his trend diagnosis tattooed on his arm, said it can be one of three trends, up, down, or sideways. I thought he would be talking about the longer-term downtrend which I was focused on, but I was the bull for the debate. The trend was sideways for him at the time over the last 45 days. So timeframe is important when asking investors what they think about a chart.
Up, down or sideways
The difference between Dave's timeframe and mine can be seen better on the daily chart. $BTCUSD moved sideways from late August through early October at the time of the conference. There was a sudden spike up and a retreat in there. As the stock market was making lower lows below the June lows, $BTCUSD had stabilized and did not take out the June low which was positive if it was going to start holding better than the stock indexes.
After October 13, the stock markets started to climb out of the hole, and $BTCUSD started to move up too. The trend was starting to turn from sideways to up. That is what I wanted to see. I placed a small trade in the positive direction.
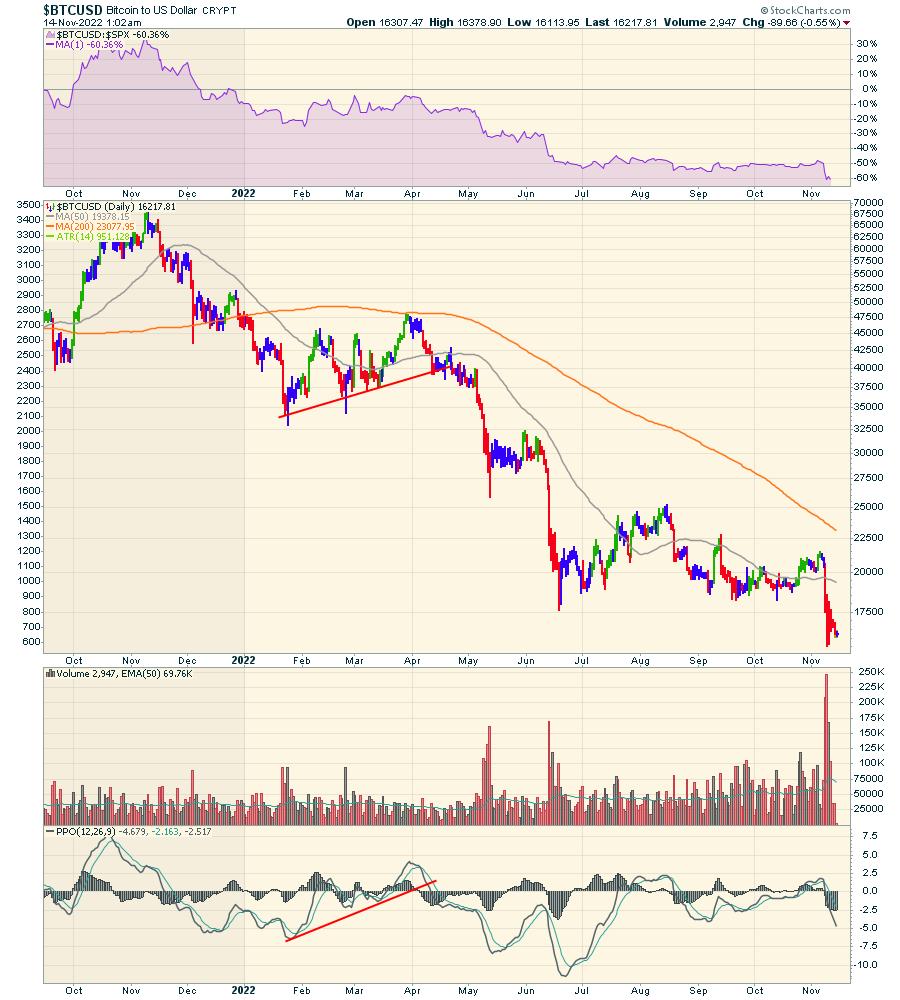
CHART 2: THINGS LOOKED GOOD FOR $BTCUSD IN OCTOBER. Alas, it didn't continue in the direction it looked like it would move. Chart source: StockCharts.com. For illustrative purposes only.
But negative news doesn't trend well. As the FTX debacle hit the news, $BTCUSD collapsed, losing 30% in a few days. Volume soared. Some investors are still holding. The reach of FTX across the industry was not something I was aware of. I spoke with my friend and sold the position. Out with a loss.
Now the next question comes to the fore. When to get back in? What about buying this low with huge volume that looks capitulatory?
In the cryptocurrency space, there have been other spectacular collapses and there will be more. Luna, Solana, Dogecoin, and many others have ridden the wave of attention to this asset class only to put a dagger in those willing to be involved. The Mt Gox exchange blew up back in 2014. And now, FTX.
FTX collapse
Let's examine a little more than the chart here because I think there's one piece of news that changed this time.
FTX was supposed to be an institutional-level service to help investors manage various coins. But things didn't pan out that way, as we found out last week.
An institution that wants to invest in crypto-related offerings has a fiduciary duty to manage client assets and the FTX exchange was a 'solution' for that. It had big minds on both sides. Investing through FTX was supposed to be at the institutional level.
Until institutions can meet this fiduciary responsibility, it's going to be difficult for them to invest in the space. Without institutional-level investors, the retail public can slosh around, but trying to build a new uptrend is akin to trying to raise the level of a lake with a one-gallon jug. It's not going to happen.
On top of that, investors like Cathie Wood's ARK funds have been investing in leading-edge, some would say bleeding edge, technology. While Cathie's ARK has long since sailed, some of her investments have had a rough track record from day one. One in this space was Coinbase (COIN).
Coinbase Price Action
COIN IPO'd to spectacular attention, as the VC's behind it were willing to feed the euphoric appetite of 2021's next generation of new investors with exciting new offerings. The stock topped on the first day of trading at $429.54 and the low in May was more than 90% off its high. The new spike down this week was just short of a 90% discount off the high.
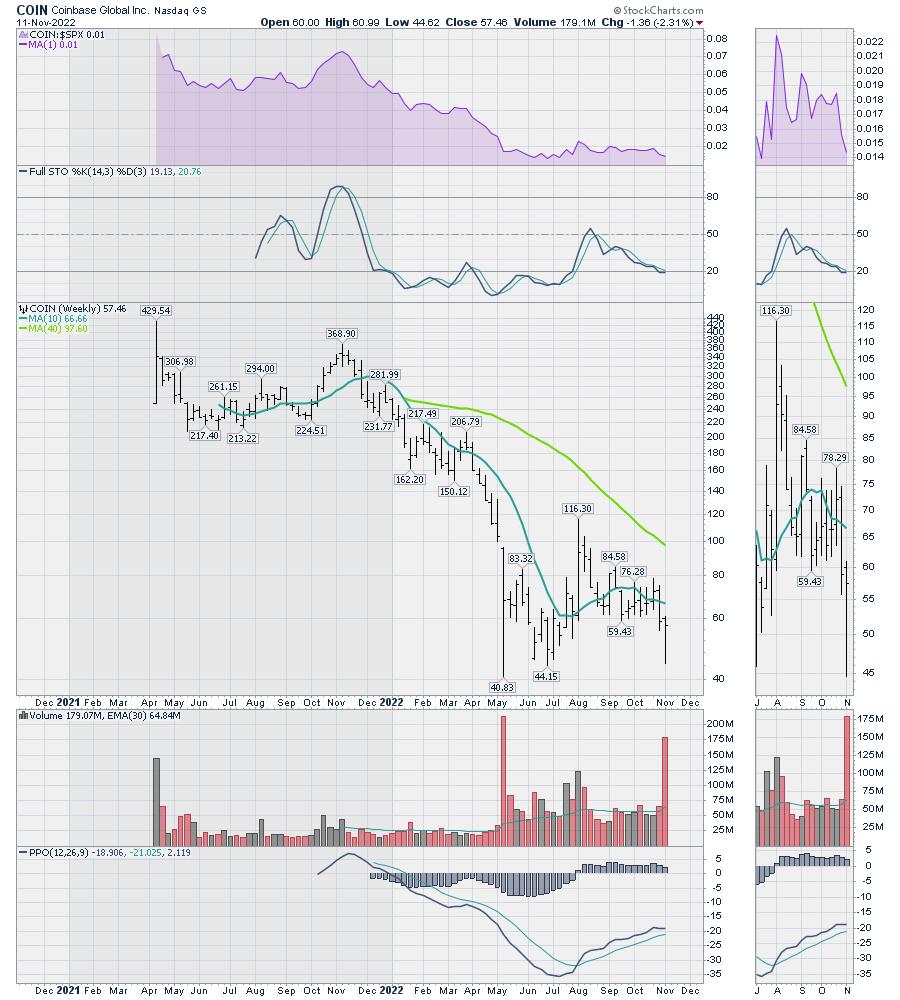
CHART 3: RELATED PAIN. Coinbase (COIN) also felt the pain. Chart source: StockCharts.com. For illustrative purposes only.
Long-term investing for the next 10 years can be a dangerous way to protect capital. Trading parabolic charts on the downside can be more difficult than trading them when they're on the upside. If you're considering investing in the next great setup, you should buy it with a stop and be prepared to lose the difference between the buy point and the stop. Otherwise, you may end up with a short investing career.
The Bottom Line
Now that you've got the technical analysis viewpoint of what happened to $BTCUSD this week, what does it mean for the chart going forward? What we know is the chart is in a downtrend. That'll need to change but it may take a while.
Good trading,
Greg Schnell, CMT, MFTA
Senior Technical Analyst, StockCharts.com
Author, Stock Charts For Dummies
Want to stay on top of the market's latest intermarket signals?
– Follow @SchnellInvestor on Twitter
– Connect with Greg on LinkedIn
– Subscribe to The Canadian Technician
– Email at info@gregschnell.com


